6 months agoMicrosoft Excel Tutorial for Beginners | Excel Training | FREE Online Excel courseCreative World
11 months agoExcel Charts: Matrix or Excel Panel Charts - Showing many variables at onceLeila Gharani
11 months agoMicrosoft Excel: How to Improve your Charts & Tables for Better Communication - PromoLeila Gharani
11 months agoExcel Advanced Charts: Comparison to Budget, Previous Year and Forecast or OutlookLeila Gharani
10 months agoHow to Create an Organizational Chart Linked to Data in Excel (Easy & Dynamic)Leila Gharani
11 months agoExcel Charts: Stacked Chart Dynamic Series Label Positioning for Improved ReadabilityLeila Gharani
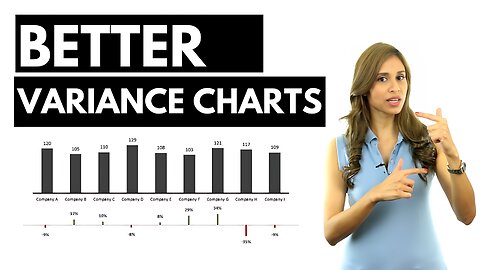
11 months agoBetter Excel Variance Charts to show percentage change (Simple & uncommon technique)Leila Gharani
11 months agoAutomatically skip blanks in Excel charts with formulas (ignore gaps in Excel chart axis)Leila Gharani
27 days agoInstant solution to Grey Background on Pasted Data from CHAT GPT. on EXCEL WORD and POWERPOINTGorgeousExcel