Excel Waterfall Promo: Ultimate Excel Waterfall Chart Course on XelPlus
Oct 27, 2016
For the complete course click here: https://courses.xelplus.com/
Excel Waterfall Chart Tutorials show you how to design any Waterfall Chart in Excel - In ANY version of Excel too.
Ultimate Excel Waterfall Chart course summary:
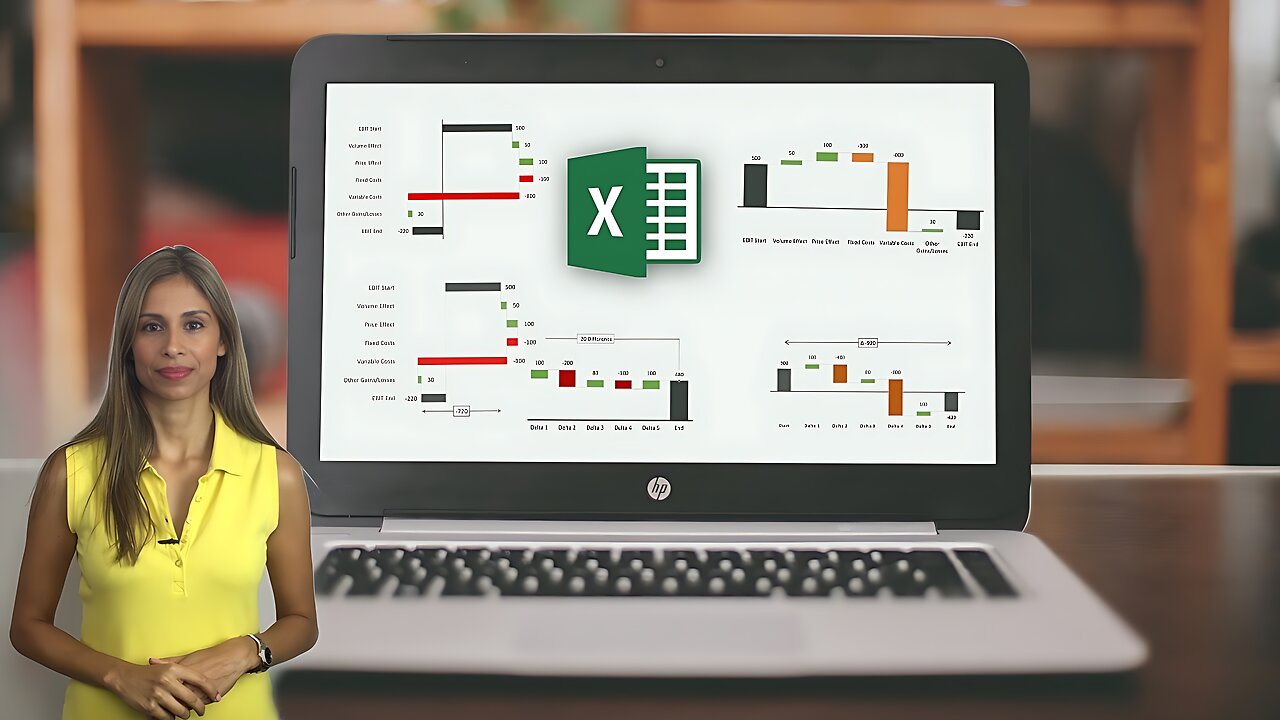
A waterfall or a bridge chart is a way of visualizing data that explains the movement from one balance to another balance. They are common in corporate reports – because they help to easily visualize the factors that are responsible for the change – for example how you got from gross sales to net income or how your profit developed from last year to this year. But they are also a good story teller for non-financial data.
In this course you will learn to create different impressive variations of the waterfall from scratch.
By the end of this course, you will be able to create your own customized variation of the waterfall chart which you can include in your corporate reports. You’re also going to learn a handful of useful tricks which you can use to create other amazing charts.
Your colleagues and management will certainly be impressed.
Here is an overview of the topics covered:
- Shortcomings of Excel 2016 in-built Waterfall Chart
- How to create the easiest Waterfall Chart EVER – (No stacked columns - works with negative values as well)
- How to add sub-totals to the waterfall chart
- Real business examples of Waterfall charts
- How to overcome real-world issues such as
- Long category labels on the horizontal axis
- Adding dynamic connectors to improve readability
- How to deal with very small delta values
- Vertical Waterfall chart (bar version of the Waterfall) and creating them in impressive ways
- Over 4 hours of Waterfall variations
- Workbook included and Cheat sheets to be uploaded soon
In this training I’m going to cover different alternatives for creating the waterfall chart. One alternative is obviously the new Excel 2016 standard waterfall, but as we dig deeper we will come across many limitations which will lead us to create it from scratch. That’s why you can take this course, no matter which Excel version you have.
The target audience for this course is anyone who is interested in creating different variations of the waterfall in Excel. You might be a controller, financial analyst, someone responsible for creating corporate reports or you might just be interested to improve your Excel charting skills and want to learn advanced tricks to create impressive graphs.
Other related videos:
https://youtu.be/JOhlazCSo6Q
https://youtu.be/a122Aa_PPZ4
https://youtu.be/8hXSAbalZuw
Other Chart videos:
https://youtu.be/9y2OubgWhpE
https://youtu.be/cYHOezDL8SQ
https://youtu.be/FPxCKs4OlWE
https://youtu.be/5nf8rucx80E
https://youtu.be/_U2gbLmEwec
-
 2:50:16
TimcastIRL
7 hours agoSupreme Court May OVERTURN Gay Marriage, SCOTUS Hearing Set For TOMORROW | Timcast IRL
221K122 -
 4:06:47
Barry Cunningham
8 hours agoBREAKING NEWS: PRESIDENT TRUMP HOSTS A STATE DINNER | FOX NATION PATRIOT AWARDS!
101K65 -
 4:04:59
Alex Zedra
5 hours agoLIVE! New Game | The See Us
29.1K1 -
 1:56:30
ThisIsDeLaCruz
5 hours ago $0.05 earnedOn The Road With Pantera
31.8K3 -
 LIVE
LIVE
meleegames
5 hours agoMelee Madness Podcast #58 - They Changed What ‘It’ Was & It’ll Happen to You
126 watching -
 2:32:46
megimu32
6 hours agoOn The Subject: Why K-Pop Demon Hunters Feels Like 90s Disney Again
30.1K9 -
 1:38:28
Glenn Greenwald
9 hours agoThe Fraudulent GOP War Against Tucker and Nick Fuentes; Dick Cheney: Hero of the Resistance; Lindsey Graham's Deranged RJC Comments | SYSTEM UPDATE #544
108K116 -
 LIVE
LIVE
ThePope_Live
5 hours agoRedsack with the boys Cheap, Jah and Nova!
787 watching -
 LIVE
LIVE
Hernandez2787
8 hours agoArc Raiders - 1st Playthrough/ Celebrating My Anniversary as Sergeant First Class in the US Army
47 watching -
 48:42
48:42
Donald Trump Jr.
10 hours agoCommunism vs Common Sense, What's Next for NYC? | TRIGGERED Ep.289
146K284