Better Excel Variance Charts to show percentage change (Simple & uncommon technique)
Apr 6, 2017 Excel Charts
Complete Advanced Excel Chart Course: https://courses.xelplus.com/p/excel-charts-visualization-secrets-for-impressive-charts
In a previous video (https://rumble.com/v2skmji), I showed you how you can use conditional formatting in Excel Column or Excel Bar charts. I also showed you how you can conditionally format the data labels in Excel graphs to show a different color if the values are positive to when the values are negative.
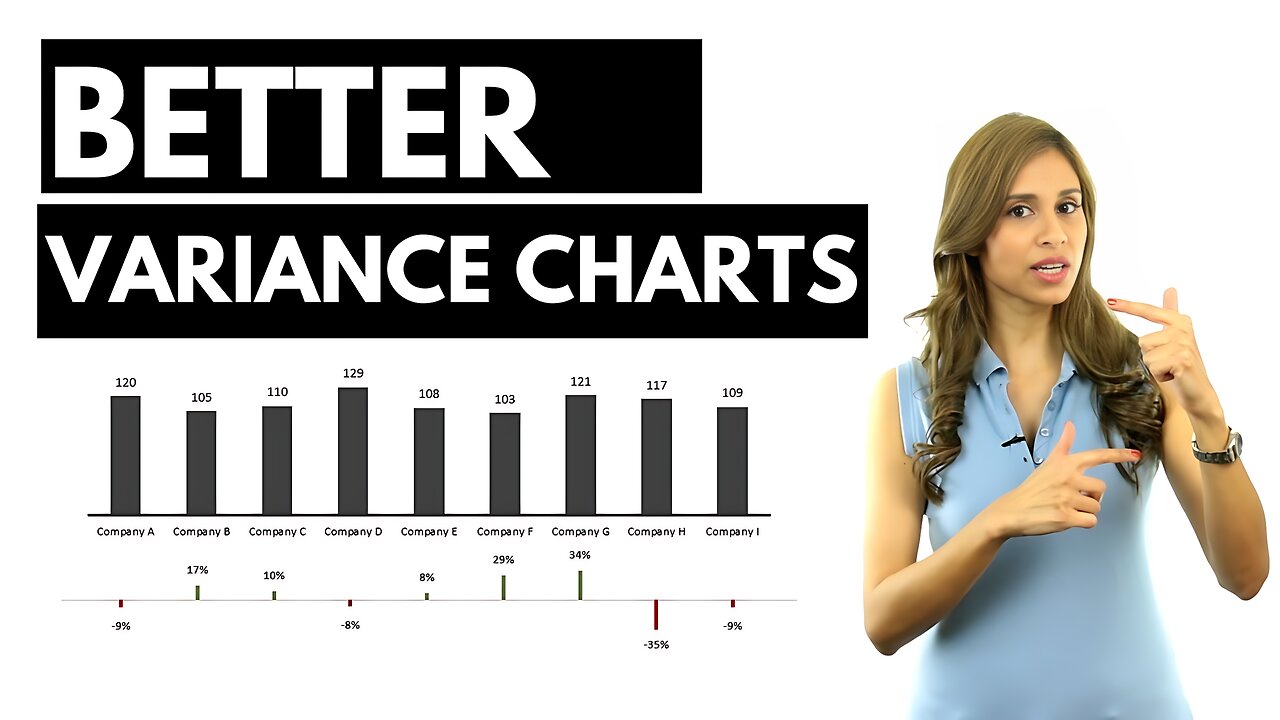
What I didn't like about that chart was that it was too bulky - and it took away attention from the main column chart that showed the actual sales numbers.
In this video, I show you how you can use the Excel error bar technique to create really thin bars (or thick lines) which has a more subtle effect. The result is a visually effective chart that doesn't distract the readers attention from the main chart but also communicates the difference to previous year visually as well.
The chart doesn't just use the error bar technique but it also conditionally formats the bars so they are green if the data points are positive and red if the data points are negative.
This technique works for Excel 2007, 2010, Excel 2013 and Excel 2016.
★ My Online Excel Courses ► https://courses.xelplus.com/
✉ Subscribe & get my TOP 10 Excel formulas e-book for free
https://www.xelplus.com/free-ebook/
EXCEL RESOURCES I Recommend: https://www.xelplus.com/resources/
Get Office 365: https://microsoft.msafflnk.net/15OEg
Microsoft Surface: https://microsoft.msafflnk.net/c/1327040/451518/7593
GEAR
Camera: https://amzn.to/2FLiFho
Screen recorder: http://techsmith.pxf.io/c/1252781/347799/5161
Microphone: https://amzn.to/2DVKstA
Lights: http://amzn.to/2eJKg1U
Note: This description contains affiliate links, which means at no additional cost to you, we will receive a small commission if you make a purchase using the links. This helps support the channel and allows us to continue to make videos like this. Thank you for your support!
#MsExcel
-
 20:41
20:41
Stephen Gardner
6 hours ago🔥You Won't BELIEVE What JUST Happened To Don Trump Jr.!!
66.8K120 -
 58:00
58:00
The StoneZONE with Roger Stone
4 hours agoEuropean Leaders Resist Trump Peace Overtures To Their Own Demise | The StoneZONE w/ Roger Stone
48.4K9 -
 9:29
9:29
AlaskanBallistics
5 hours ago $1.77 earnedWyoming Suppressors and Rifles at Shot Show 2025
40K2 -
 1:06:40
Donald Trump Jr.
9 hours agoThe Left is Taking one L After Another, Live with Michael Knowles | Triggered Ep. 217
139K99 -
 47:17
47:17
Kimberly Guilfoyle
9 hours agoWoke Gets DOGE’d, Live with AJ Rice & Jarrett Stepman | Ep. 197
105K41 -
 20:11
20:11
Candace Show Podcast
8 hours agoBecoming Brigitte: Candace Owens x Xavier Poussard | Ep 6
157K301 -
 8:25:38
Dr Disrespect
12 hours ago🔴LIVE - DR DISRESPECT - ELDEN RING DLC - REVENGE
173K21 -
 54:22
54:22
LFA TV
1 day agoThe End of the Trans-Atlantic Alliance | TRUMPET DAILY 2.17.25 7PM
36.5K6 -
 55:56
55:56
BIG NEM
11 hours agoUGLY COCO: The Rapper Who’s Tried EVERY PSYCHEDELIC 🌌
12.2K1 -
 1:42:51
2 MIKES LIVE
8 hours ago2 MIKES LIVE #181 Deep Dive Monday!
19.2K3