Premium Only Content

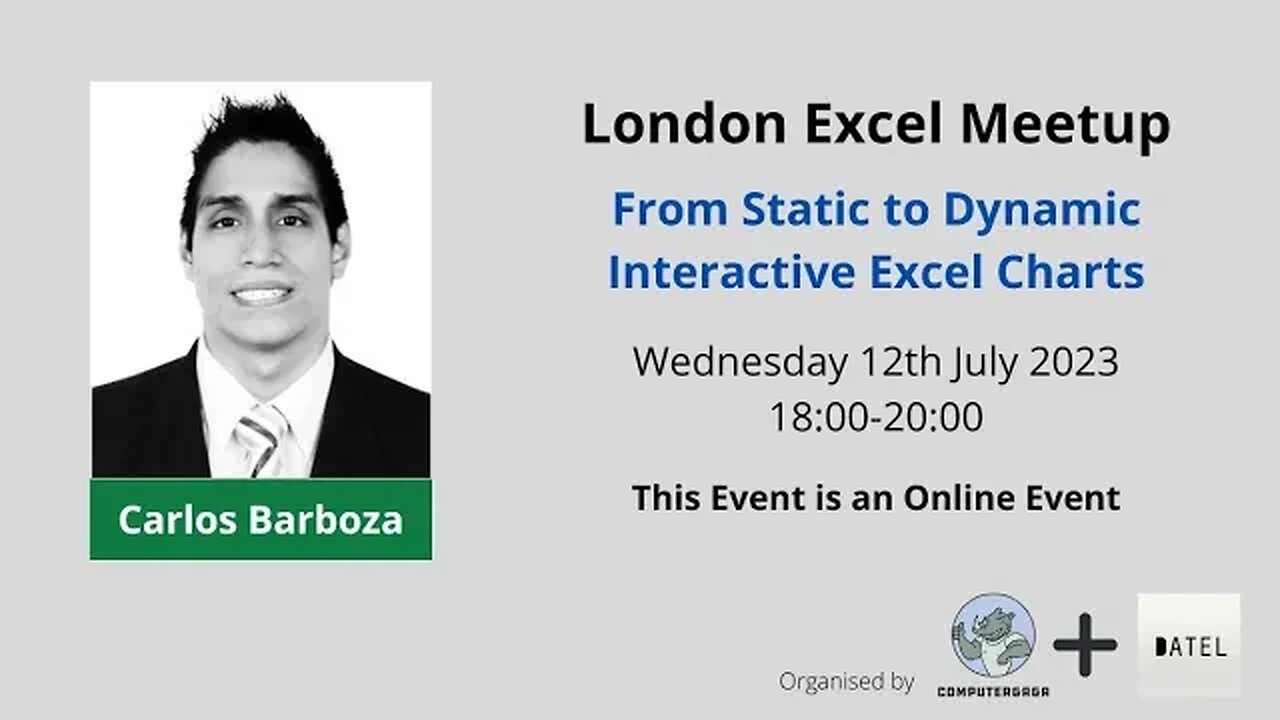
From Static to Dynamic Interactive Excel Charts | Carlos Barboza
In this meetup, Carlos Barboza presented on creating dynamic and interactive Excel charts.
What to Expect
Learn how to create interactive Excel charts using the dynamic array functions in Excel. With these functions, we can implement interactive charts easier than before.
The only thing you must learn is the logic of spilled ranges so you can easily reference them to your charts. Learn some chart tips and Excel tricks along with some graphs types and pro tips.
About the Speaker
Carlos Barboza is a bilingual data consultant with 6 years of experience. He started his career in analytics using Microsoft Excel as his swiss army knife.
He holds a Bachelor in Economics and Finance from University of Hartford. Currently, as consultant with Microsoft tools, Carlos is interchangeably switching between Power BI and Excel to analyze large volume of data thru data visualization, interaction and exploratory visual analysis. His current main interest today is the science of data visualization for analysis of information.
Office Scripts course https://bit.ly/3pKjzT0
(Use code LEM100 for a huge 45% discount)
Get involved and attend future London Excel Meetups - https://www.meetup.com/London-Excel-Meetup-Group/
Find more great free tutorials at;
https://www.computergaga.com
*** Online Excel Courses ***
The Ultimate Excel Course – Learn Everything ► https://bit.ly/UltimateExcel
Excel VBA for Beginners ► http://bit.ly/37XSKfZ
Advanced Excel Tricks ► https://bit.ly/3CGCm3M
Excel Formulas Made Easy ► http://bit.ly/2ujtOAN
Creating Sports League Tables and Tournaments in Excel ► http://bit.ly/2Siivkm
Connect with us!
LinkedIn ► https://www.linkedin.com/company/18737946/
Instagram ► https://www.instagram.com/computergaga1/
Twitter ► http://www.twitter.com/computergaga1
-
 LIVE
LIVE
Side Scrollers Podcast
1 day ago🔴SIDE SCROLLERS SUB-A-THON🔴FINAL DAY!🔴Craig Makeover + US Dart Throw + More!
14,034 watching -
 2:05:58
TimcastIRL
6 hours agoSHOTS FIRED, Leftists ATTACK Coast Guard & Feds In SHOCK Terror Attack | Timcast IRL
212K114 -
 LIVE
LIVE
Man in America
12 hours agoThe BRICS War on the Dollar Just Hit Endgame—What's Next Changes EVERYTHING
1,174 watching -
 LIVE
LIVE
SOLTEKGG
3 hours ago🔴LIVE - Community Game Night - GIVEAWAY
250 watching -
 LIVE
LIVE
SpartakusLIVE
5 hours ago#1 Friday Night HYPE, viewers GLUED to the screen
273 watching -
 55:50
55:50
NAG Podcast
4 hours agoAda Lluch: BOLDTALK W/Angela Belcamino
531 -
 LIVE
LIVE
VapinGamers
1 hour agoKellan Graves - Fallen - Game Review and Game KeyGiveaway - !rumbot !music
88 watching -
 1:06:41
MattMorseTV
4 hours ago $32.28 earned🔴Trump PREPARES for WAR with VENEZUELA.🔴
28.1K45 -
 39:59
39:59
Clownfish TV
8 hours agoHollywood NO MORE! Animation Industry Will DIE First?! | Clownfish TV
6302 -
 25:57
25:57
The Kevin Trudeau Show Limitless
2 days agoThe Sound Of Control: This Is How They Program You
54.9K17