

TradeStation tutorial 171 | Correlation indicator for when bars ‘missing’ in a data stream
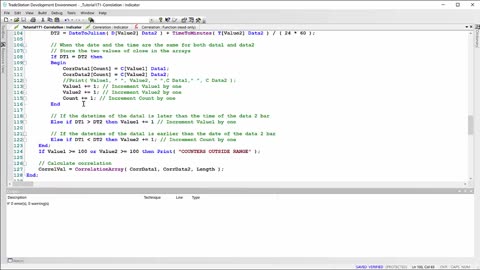
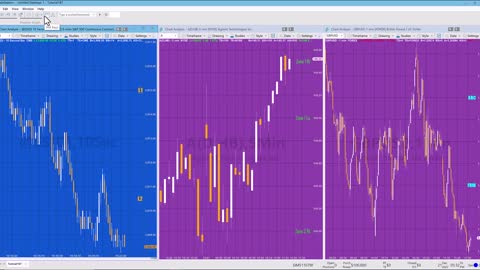
Tutorial 171 for TradeStation EasyLanguage, demonstrates how to create a correlation indicator for data pairs where one of the data pairs has ‘missing bars.’ For example, for symbol 1 (data1) trading might have occurred on every bar during the trading session. Symbol 2 might be more thinly traded and hence it doesn’t have trading activity on every bar.
See https://markplex.com/free-tutorials/tutorial-171-correlation-indicator-when-bars-missing/
Join Gold Pass: https://markplex.com/markplex-membership/
3
views
Tutorial177_consolidator | Recognizing periods of consolidation
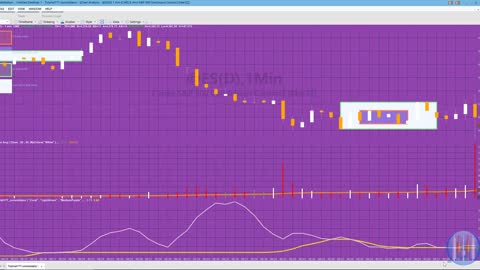
Consolidation describes a period in time when a stock or security is not in or reversing a larger price trend. During consolidation the instrument typically trades within a limited price range. Tutorial 177 is a TradeStation EasyLanguage tutorial that attempts to recognize periods of consolidation by calculating:
1) The standard deviation of price.
2) The ‘Consolidation Index’ by taking the average of true high over a number of bars, subtracting the average of the true low and dividing the result by the Average True Range.
The tutorial program then looks for when these values go below a user input percentile.
When a period of possible consolidation is found, tutorial 177 draws a box around it with the high of the box being the highest close of the price in the box and the low being the lowest low close of price in the box.
Because periods of consolidation are sometimes associated with low volume the tutorial also changes the color of the boxes when volume is below the average volume. The colors are also determined by user inputs.
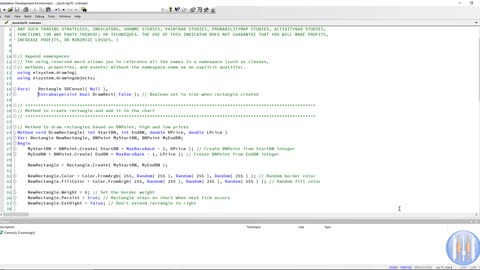
This tutorial illustrates various programming techniques, including:
- Drawing rectangle and text drawing objects using BNPoints and XYPoints to specify their size and/or position
- Creating methods to draw rectangles and calling the methods
- Extending rectangles as new price bars form
- Modifying drawing object colors and transparency
- Using intrabarpersist booleans to detect when a percentile has been crossed
See https://markplex.com/free-tutorials/_tutorial177_consolidator-recognizing-periods-of-consolidation/
3
views
TradeStation Tutorial 178 | Using ELCollection to share a string with another chart
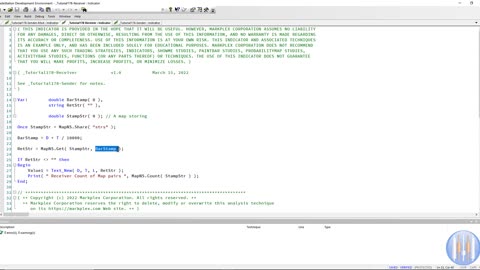
TradeStation EasyLanguage Tutorial 178 uses ELCollections to share a text string with another chart that uses the same interval setting, but not necessarily the same symbol. Even through the same results could be obtained using GlobalDictionary in TradeStation, this is not available in MultiCharts whereas ELCollections works in both TradeStation and MultiCharts.
See https://markplex.com/free-tutorials/tutorial-178-using-elcollection-to-share-a-string-with-another-chart/
4
views
QuickTip 72 | Using the TokenList class
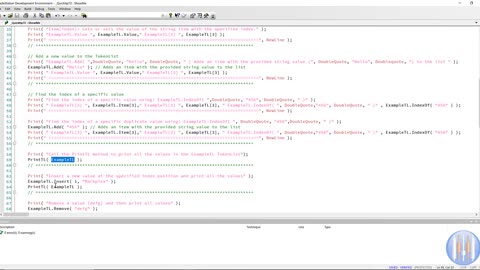
Quicktip72 is a TradeStation EasyLanguage quicktip from markplex.com that demonstrates how to use the TokenList class. The program is available for Gold Pass members.
https://markplex.com/free-tutorials/tradestation-easylanguage-quicktips/quicktip-72-using-the-tokenlist-class/
3
views
Quick-tip 73 | Some basic differences between TradeStation 9.5 and 10
A visitor to markplex.com had noticed that some of the earlier EasyLanguage tutorials and programs were developed using TradeStation 9.5. He asked me to explain some of the differences between the two versions.
3
views
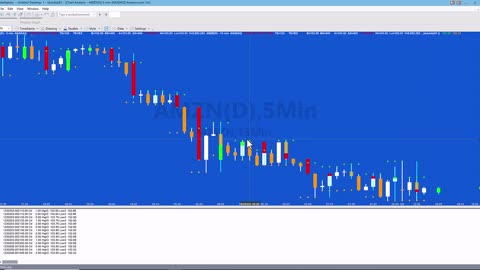
Tutorial 181 | Three Line Break on minute chart using a vector object | TradeStation tutorials
Tutorial 181 from Markplex.com talks through the creation of an indicator to ‘mimic’ the behavior of a three line break chart. The functionality is very similar to tutorial 23 however, whereas tutorial 23 uses an array, this tutorial uses the Vector class.
See the tutorial pages:
Tutorial 23 - https://markplex.com/free-tutorials/tutorial-23-creating-3-line-break-3lb-indicator-apply-normal-candlestick-charts/
Tutorial 181 - https://markplex.com/free-tutorials/tutorial-181-three-line-break-on-normal-chart-using-vectors/
Line break charts
Line breaks charts ignore time. New ‘up’ lines are only added when a bar closes higher than the high of the previous up line. Once up lines are being drawn price has to go below the low of a specified number of up lines in order to create a new down line. New ‘down’ lines are only added when a bar closes below than the low of the previous down line. Once down lines are being drawn price has to go above the high of a specified number of down lines in order to create a new ‘up’ line.
This tutorial program is designed to be applied to a minute (e.g. 5 minute, 15 minute, 60 minute) bar chart. Because these charts do have a linear time element multiple ‘lines’ would be drawn whereas on an actual line break chart the same move would be represented by one line.
Technical lessons covered in this tutorial include:
Converting an EasyLanguage program to use a Vector rather than an array
Drawing rectangles using the legacy EasyLanguage syntax (e.g. TL_New) and also using the Rectangle object and formatting options
Converting legacy date and time to a DateTime object
Converting color objects for use in the plot statement
Using methods to create and update drawing objects
Ensuring that there are only a maximum number of drawing objects drawn on the chart.
4
views
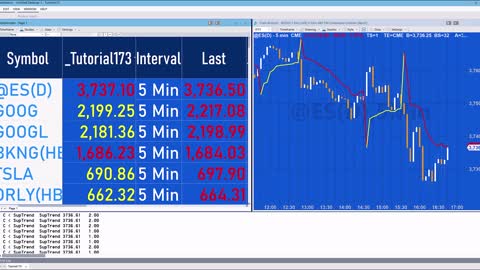
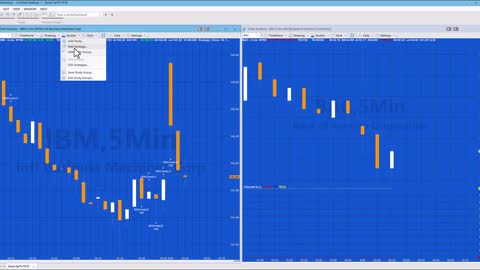
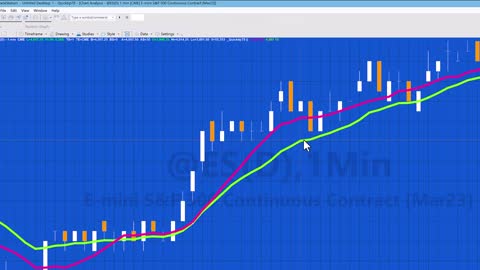
Tutorial 173 (Markplex Supertrend) for Radarscreen | TradeStation EasyLanguage tutorials
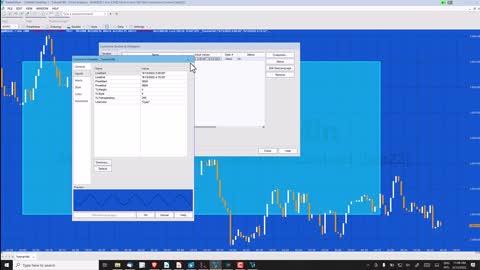
This video demonstrates how to set up Tutorial 173 (Markplex SuperTrend) in TradeStation RadarScreen. This involves making sure that "load additional data for accumulative calculations" is selected and an appropriate number of bars is entered. "Load additional data" is required for calculations that use the value of the calculation the previous bar to give the value for the current bar.
Tutorial 173 uses the exponential moving average as part of its calculation. If you open the XAverage function, you will see the calculation is:
XAverage = XAverage[1] + SmoothingFactor * ( Price - XAverage[1] );
In other words, the exponential moving average for the current bar is equal to the exponential moving average for the previous bar plus the difference between the price of the current bar and the exponential moving average of the previous bar, multiplied by a smoothing factor.
TradeStation recommend that the number of additional bars is equal to 4.5 multiplied by the Length input. In this video I estimated this to be 50.
See https://markplex.com/free-tutorials/tradestation-easylanguage-quicktips/quick-tip-5-indicator-works-fine-chart-not-radarscreen/
and
https://markplex.com/free-tutorials/tutorial-173-markplex-supertrend/
5
views
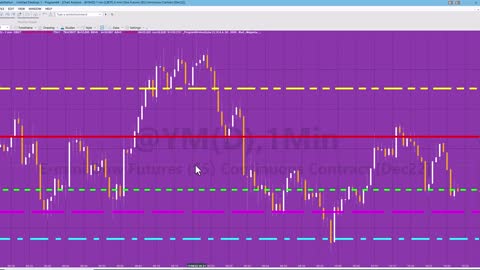
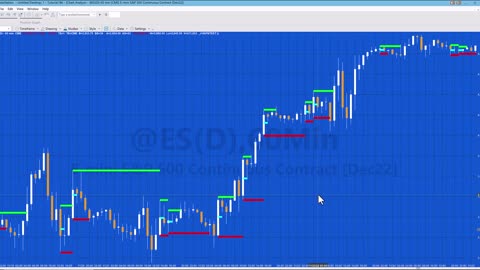
Program 84 | Support and Resistance Lines based on Pivots in a TradeStation PSP
Program84-HorizLine creates horizontal support and resistance lines based on the record of levels of previous pivots. The program is similar to program 55 but instead of looking for pivots in the bars of the current chart, it uses a price series provider to search for pivots in a different bar interval. The idea behind the program is that if pivots have occurred at a specific level before, then that price level may have some significance, especially if they have occurred at the same level (or near to the same level) on several occasions before.
The program is designed for minute based charts (1, 2, 3, 5, 15 minute etc) with the price series provider having a greater interval. For example, it could be applied to 5 minute bars of @YM and use a 60 minute price series provider. It was written in TradeStation 10. The start time of the PSP is set to the time of the chart (after maxbarsback). Obviously, the more data you load the greater number of pivots will be found.
For download and more information: https://markplex.com/program-84-support-and-resistance-lines-based-on-pivots-in-psp/
4
views
TradeStation EasyLanguage Tutorial 187 | Draw text labels anchored to the right of the chart
Tutorial 187 for TradeStation EasyLanguage, demonstrates how to create a simple program to create text anchored to the right hand side of the chart at ten specified price levels.
https://markplex.com/free-tutorials/tutorial-187-draw-text-labels-anchored-to-the-right-of-the-chart/
7
views
TradeStation EasyLanguage tutorial 188 | Volume profile for user selected bars
Tutorial 188 is a new TradeStation EasyLanguage tutorial from Markplex that demonstrates how to select a number of bars using the drawing tool. It then paints the bars selected and analyzes and draws the volume profile.
https://markplex.com/free-tutorials/tutorial-188-volume-profile-for-user-selected-bars/
7
views
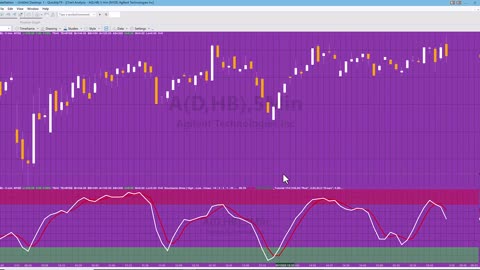
EasyLanguage Quick-tip 79 | How to use tutorial 114 to draw stochastic zones
TradeStation EasyLanguage Quick-tip 79 shows how to set up a chart using the tutorial 114 program to create colored bands on a standard stochastics indicator.
See https://markplex.com/free-tutorials/tradestation-easylanguage-quicktips/quick-tip-79-how-to-use-tutorial-114-to-draw-stochastic-zones/
3
views
TradeStation EasyLanguage quick-tip 80 | How to change a color 'hard-coded' in a program
EasyLanguage legacy color reserved words: Black, Blue, Cyan, Green, Magenta, Red, Yellow, White, DarkBlue, DarkCyan, DarkGreen, DarkMagenta, DarkRed, DarkBrown, DarkGray, LightGray,
You might also be interested in QuickTip 33 which demonstrates a method to allow the use of colors from the color class in the Plot statement.
https://markplex.com/free-tutorials/tradestation-easylanguage-quicktips/quick-tip-80-how-to-change-a-color-hard-coded-in-a-program/
7
views
TradeStation EasyLanguage quick-tip 81
TradeStation EasyLanguage Quick-tip 81 shows how to find and plot the high and low of the last three 5 minute bars, every three bars. The quick-tip also mentions the need to adjust the number of 5 minute bars if you want to have it lining up with 15 minute bars.
https://markplex.com/free-tutorials/tradestation-easylanguage-quicktips/quick-tip-81-find-and-plot-the-high-low-of-last-3-5-minute-bars/
9
views
Tutorial 202 | Calculate price to reach a user input RSI value
Tutorial 202 seeks to look at the RSI calculation and calculate what price (this bar) needs to be for the RSI to reach (or go down to) a specific value.
To achieve this the calculations the RSI calculations are solved for Price (i.e. price this bar). Because the above formula includes AbsValue, we actually solve for two eventualities (i.e when price is greater than price last bar and when price last bar is greater than price this bar).
See https://markplex.com/free-tutorials/tutorial-202-calculate-price-to-reach-a-user-input-rsi-value/
4
views
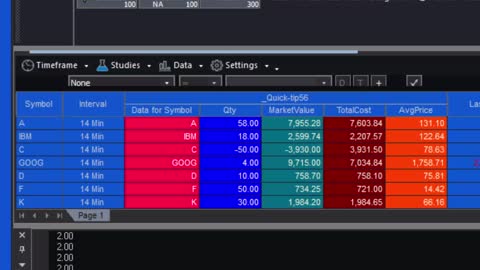
Quick-tips 56 | A positions provider applied to RadarScreen
Quick-tip 56 gives a straightforward example of using the position provider in RadarScreen.
The quick-tip shows how to find the various attributes available in this provider (e.g. quantity, market values, average price etc)
https://markplex.com/free-tutorials/tradestation-easylanguage-quicktips/quick-tip-56-using-the-positions-provider/
2
views
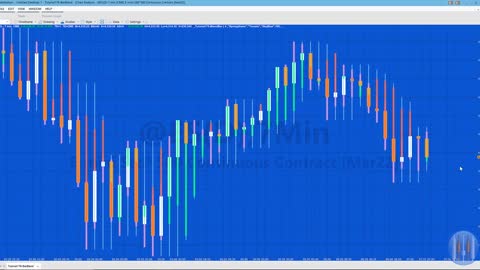
TradeStation EasyLanguage tutorial 176 | 'Blend bars'
_Tutorial176-BlendBar 'merges' the open, high and low for a user input number of bars to create a 'blended bar.' For example, if the user input BlendNum were set to 3 the the high of the 'blend bar' would be the highest high of the current bar and the two before it. The low would be the lowest low, the open would be the 3 bars ago and the close, the close of the current bar.
This tutorial demonstrates two ways that the 'blend bars' can be included on the chart:
1. using a paintbar and
2. drawing the bars. With the second option the bars are drawn using the trendline objects.
This tutorial illustrates various programming techniques, including:
Using trendline drawing objects
Using a text string text string to create a color object
Changing the transparency of a color object
Managing the number of drawing objects on the chart
See https://markplex.com/free-tutorials/tutorial-176-blend-bar-study/
To join the Markplex email newsletter, go to https://markplex.com/news
2
views
TradeStation EasyLanguage Quick-tip 70
Quick-tip 70 explains, with examples, the use of the persist property in drawing objects. It also explains the use of a boolean variable to flag when a drawing object has been added to the chart and why this variable should be set as an intrabarpersist variable.
See https://markplex.com/free-tutorials/tradestation-easylanguage-quicktips/quick-tip-70-using-intrabarpersist-variables-when-drawing-objects/
2
views
Tutorial 180 | Text Objects Basics | Part 1
TradeStation EasyLanguage Tutorial 180 demonstrates how to draw a line, a rectangle and a text label by specifying a start date, time and price and an end date, time and price. The times can be specified to the second. The tutorial uses Parse method of the DateTime class to convert user input strings (in mm/dd/yyyy hh:mm:ss format) into DateTime objects. These values are combined with user input prices to create DTPoint objects using DTPoint.Create. These DTpoints are then used to create a trendline, a rectangle and a text label.
Additional functionality is included so that the rectangle is drawn even if the end date time is not currently visible on the chart. This is achieved by checking the current BarDateTime at the beginning of each bar. If it is less than the LineEndTime then the rectangle has its end time set to the most right display datetime. This is repeated as each new bar is added to the chart, until the bar DateTime is equal to or greater than the end time.
Technical lessons covered in this tutorial include:
– Drawing lines, rectangles and text objects
– Using DateTime.Parse to convert a string to a DateTime object
– Using methods to create and update drawing objects
– Using ‘Composite Formatting’ to print data
– Ensuring a rectangle is visible even if the end datetime is not currently on the chart
This tutorial does not work with MultiCharts.
https://markplex.com/free-tutorials/tutorial-180-text-objects-basics/
2
views

Tutorial 180 | Text Objects Basics | Part 2
TradeStation EasyLanguage Tutorial 180 demonstrates how to draw a line, a rectangle and a text label by specifying a start date, time and price and an end date, time and price. The times can be specified to the second. The tutorial uses Parse method of the DateTime class to convert user input strings (in mm/dd/yyyy hh:mm:ss format) into DateTime objects. These values are combined with user input prices to create DTPoint objects using DTPoint.Create. These DTpoints are then used to create a trendline, a rectangle and a text label.
Additional functionality is included so that the rectangle is drawn even if the end date time is not currently visible on the chart. This is achieved by checking the current BarDateTime at the beginning of each bar. If it is less than the LineEndTime then the rectangle has its end time set to the most right display datetime. This is repeated as each new bar is added to the chart, until the bar DateTime is equal to or greater than the end time.
Technical lessons covered in this tutorial include:
– Drawing lines, rectangles and text objects
– Using DateTime.Parse to convert a string to a DateTime object
– Using methods to create and update drawing objects
– Using ‘Composite Formatting’ to print data
– Ensuring a rectangle is visible even if the end datetime is not currently on the chart
This tutorial does not work with MultiCharts.
https://markplex.com/free-tutorials/tutorial-180-text-objects-basics/
2
views
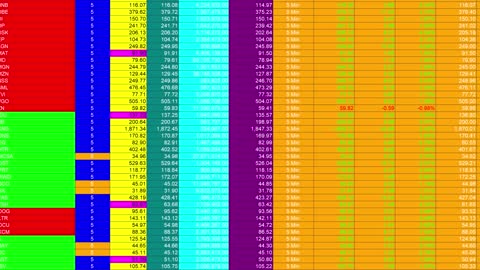
Tutorial 183 | Controlling background color in RadarScreen | TradeStation EasyLanguage tutorials
It is not possible to change the background color of a RadarScreen cell in the symbol column using TradeStation EasyLanguage. The background color of this column can be set as a property of the RadarScreen settings page but not programmatically.
But what if you needed more control over the plot colors, for example, to provide a visual alert? Tutorial 183 demonstrates a way of achieving this by replotting information and then using the SetPlotBGColor keyword to change the background color.
Tutorial 183 demonstrates how to:
1. Change the color of a complete column
2. Change the color of specific cells based on the symbol name or a value
3. Make cells flash on and off
4. Change the color of cells when they are clicked
The tutorial uses the quotes provider, the timer and the RadarScreen host provider (as well as TradeStation RadarScreen).
See https://markplex.com/free-tutorials/tutorial-183-controlling-background-color-in-radarscreen-tradestation-easylanguage-tutorials/
3
views
Tutorial 186 | Inside and outside bar high and low lines | Part 2 using legacy drawing tools
This first tutorial 186 function checks for inside bars and outside bars and then draws the high and the low of the pattern until either line is breached by price. The other line continues to be drawn (i.e if the price goes below the low line, it is stopped but the high line continues to be drawn.)
The lines are drawn using the legacy drawing tools.
See the program page here: https://markplex.com/free-tutorials/tutorial-186-inside-and-outside-bar-lines/
2
views
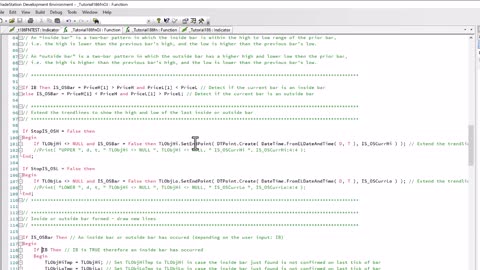
Tutorial 186 | Inside and outside bar high and low lines | Part 3: Function using Drawing Objects
This first tutorial 186 function checks for inside bars and outside bars and then draws the high and the low of the pattern until either line is breached by price. The other line continues to be drawn (i.e. if the price goes below the low line, it is stopped but the high line continues to be drawn.)
The lines are drawn using drawing objects (as opposed to the legacy drawing tools.)
See the program page here: https://markplex.com/free-tutorials/tutorial-186-inside-and-outside-bar-lines/
2
views
Quick-Tip 78 | Indicator plot formatting options
Quick-tip 78 demonstrates three different ways of formatting indicator plots.
Using the ‘customize study’ after the indictor has been applied to the chart
With the indicator open in the development environment, right click and select properties
Coding the plot statement
The quick-tip also explains how to make some of the settings the default settings.
3
views
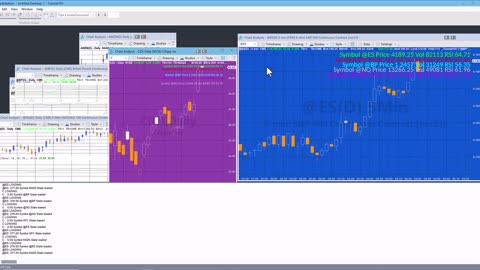
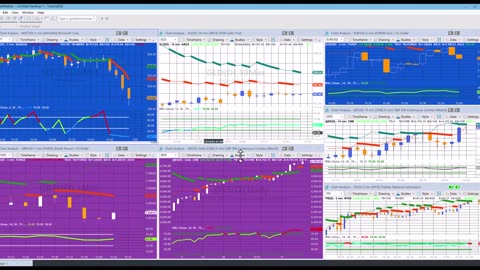
Tutorial 191 | Information panel based on daily data
Tutorial 191 demonstrates how to create a program to display a panel of information about another symbol.
https://markplex.com/free-tutorials/tutorial-191-information-panel-based-on-daily-data/
The information displayed includes the symbol name, closing price, daily volume and the Relative Strength Index (RSI) calculated using daily data from a Price Series Provider (PSP). In the example shown above, the indicator is applied 5 times as part of a ‘study group.’
The program uses the PSP to provide the data for a symbol different from the charted symbol. The tutorial also demonstrates a way of calculating the RSI value using this PSP data.
Technical Lessons
Technically, the tutorial program 91 is based around a price series provider (PSP). Because we are interested in daily information about a symbol, the PSP is the simplest way of achieving this. The PSP and an associated event were originally created using the toolbox and then the code copied from the ‘designer generated code.’ The calculation is similar to the standard RSI function, however care needs to be taken about the calculation that occurs at the end of each PSP bar.
The tutorial program also demonstrates how to create a label using 'Composite Formatting' and how to keep it stationary relative to the chart frame.
3
views
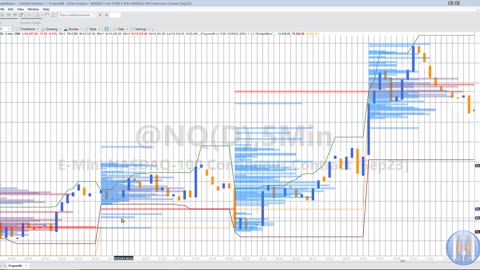
Program 86 | Recurring Volume Profile for a User Specified Time Period
See: https://markplex.com/easylanguage-programs/program-86-recurring-volume-profile-for-a-user-specified-time-period/
Program 86 uses thePrice Series Providerclass to create a volume profile for specified periods during the day. The length of this period is determined by a user input:RepeatTime. When this time elapses the volume profile is calculated and drawn. Data collection then starts for the next recurring period. This is repeated throughout the day. The profile is color coded between two user specified colors:HistColor1andHistColor2.
Having calculated the volume profile, Program 86 then calculates at which price level most volume occurred during the period being analyzed.
It also plots three horizontal lines at the following levels:
The price high of the period being analyzed
The price low of the period being analyzed
The price at which the highest volume occurred during the PREVIOUS period analyzed
Program 86 was designed and tested with TradeStation 10. It works on intraday minute bars.
The RepeatTime input determines both the time period over which the analysis takes place and when the analysis is repeated. For example, if 5 minute bars were used and the StartTime set to 1000, and RepeatTime set to 60 then the initial period analyzed would be the first tick after 1000 to 1100. The analysis would then be automatically repeated for the first tick after 1100 to 1200,first tick after1200 to 1300 etc.
This program will not work in MultiCharts because it uses the TradeStation collections and other functionality that is not available in the MultiCharts environment.
2
views