

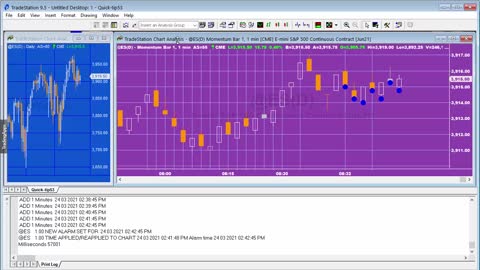
Quick-tip 53 | How to modify tutorial 116 to reload the chart data at regular intervals
Tutorial 116 (https://markplex.com/free-tutorials/tutorial-116-restarting-program-specific-intervals/) demonstrated how to force a re-calculation of a number of charts at specific intervals. The tutorial uses some of the techniques from tutorial 115, in particular the use of the Timer to issue a RecalculateException at a specific time and then at set intervals after that.
The specific code used in order to refresh the program applied to a chart is:
Throw RecalculateException.Create( "Refresh" );
This recalculate exception reloads the program applied to the chart, but it does not reload the data.
Quick-tip 53 demonstrates how to reload the data on the chart by replacing the above with the following syntax to call a macro:
Value99 = runcommand( ".Refresh" );
See https://markplex.com/free-tutorials/tradestation-easylanguage-quicktips/quick-tip-53-how-to-modify-tutorial-116-to-reload-the-data-at-intervals/
59
views
TradeStation EasyLanguage | Quick-tip 63 | Namespace explanation
Namespaces are a grouping of classes that relate to one another. Examples of namespaces in the EasyLanguage class library include:
tsdata.marketdata
Contains classes that are used to access market data such as price quotes, market levels, and fundamental values.
elsystem.drawing
Contains classes that are used to describe the color and font characteristics of form controls and drawing objects.
elsystem.drawingobjects
Contains classes that are used to create and manipulate drawing tools (trendlines, text, rectangles, etc.) in a chart window.
elsystem.office.excel
Contains base classes that are used to access data from Excel spreadsheet files.
Why Use Namespaces?
Name spaces are included in a program with the using key word.
By including namespaces means that classes, methods, properties, and events can be referenced without including the namespace.name as a qualifier.
See https://markplex.com/free-tutorials/tradestation-easylanguage-quicktips/quick-tip-63-namespace-explanation/
56
views
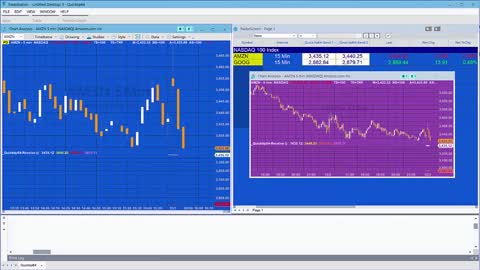
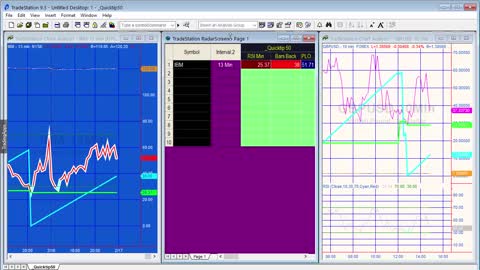
Quick-tip 64 | Global dictionary example | Radarcreen to chart (real-time)
Quick-tip 64 demonstrates the use of the Global Dictionary. In this tutorial the values of two moving averages from two rows in RadarScreen are stored in a GlobalDictionary using a sender program (_Quick-tip64-Send) and then they are read by a receiver program (_Quick-tip64-Receive) in real time. The sender program is applied twice to Radarscreen with different lengths.
The values are read from the Global Dictionary using another program (_Quick-tip64-Receive) and plotted on the receiving chart.
The syntax for creating a global dictionary varies depending on how the global dictionary will be used. To share values beyond the same window type (e.g. between a chart and RadarScreen) OR between two charts when multi-core charting is enabled.
myGD = GlobalDictionary.create( True, "share_name" );
The Share parameter value of TRUE or FALSE controls whether interprocess sharing is enabled or disabled
See https://markplex.com/free-tutorials/tradestation-easylanguage-quicktips/quick-tip-64-global-dictionary-example-radarcreen-to-chart-real-time/
43
views
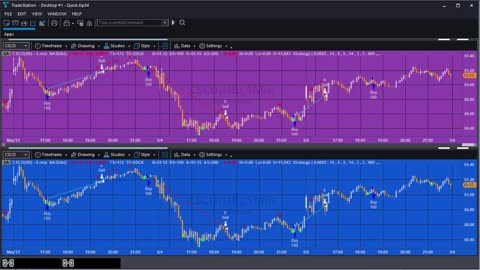
Quick-tip 54 | Modify tutorial 16 to use moving average rather than stochastics
Quick-tip 54 is TradeStation EasyLanguage tutorial that demonstrates a way of modifying tutorial 16 (https://markplex.com/free-tutorials/tutorial-16-tradestation-strategy-candlestick-patterns-stochastic-crossovers/) to use moving averages rather than stochastics.
Tutorial 16 looks for candlestick patterns, using the TradeStation standard functions, and if a certain stochastic pattern occurs enters or exits a trade. The program also uses the standard SetProfitTarget and SetProfitLoss functions.
Quick-tip 54 retains the stochastic functionality but also introduces an option to test for inequalities between 3 moving averages.
See https://markplex.com/free-tutorials/tradestation-easylanguage-quicktips/quick-tip-54-modify-tutorial-16-to-use-moving-average-rather-than-stochastics/
41
views

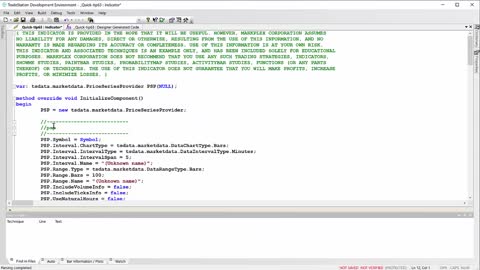
EasyLanguage tutorial 172 | Missing bar correlation using a PSP
See https://markplex.com/free-tutorials/tutorial-172-missing-bar-correlation-using-a-psp/
TradeStation EasyLanguage Tutorial 171 (https://markplex.com/free-tutorials/tutorial-171-correlation-indicator-when-bars-missing/) demonstrated how to create a correlation indicator for data pairs where one of the data pairs has ‘missing bars.’ For example, for symbol 1 (data1) trading might have occurred on every bar during the trading session. Symbol 2 might be more thinly traded and hence it doesn’t have trading activity on every bar.
Tutorial 172 modifies the tutorial 171 program so that instead of using Data2, the equivalent data is taken from a Price Series Provider.
37
views
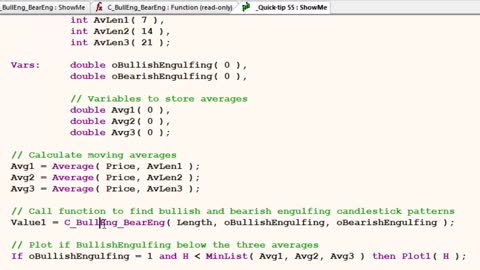
Quick-tip 55 | Plot bullish engulfing pattern below moving averages
Quick-tip is a show-me study that looks for bullish engulfing candlestick patterns where the high of the bar is below the lowest of three moving averages.
The quick tip uses the standard TradeStation C_BullEng_BearEng function to look for engulfing candlestick patterns.
A free download is available to Gold Pass members.
See https://markplex.com/free-tutorials/tradestation-easylanguage-quicktips/quick-tip-55-plot-bullish-engulfing-pattern-below-moving-averages/
31
views
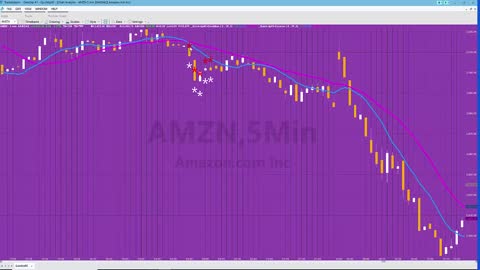
TradeStation EasyLanguage quick-tip 65 | Number of bars after cross
Quick-tip 65 demonstrates two simple of ways of finding and showing when a condition on the chart has occurred within a user input number of bars.
The quick-tip shows two ways that this can be programmed. The condition used to facilitate the demonstration is the cross of a fast moving average over a slow moving average.
Using a counter
This first technique is used in the TradeStation indicator: _Quick-tip65-Counter. In this program a counter indicator is incremented by one every bar. When the fast moving average crosses over a slow moving average the counter is reset to zero. The program draws an asterisk when the value of the counter is less than a user input value, i.e. when the cross had occurred less that that number of bars ago.
Setting a variable
In the second technique (_Quick-tip65-Condition) a variable is set to a value of 1 every time the fast moving average crosses over a slow moving average, otherwise is is set to zero. The summation function is used to check whether the sum of this variable over the user input number of bars is greater than zero. If so an asterisk is drawn on the chart.
In this example, the asterisks are displayed vertically.
See https://markplex.com/free-tutorials/tradestation-easylanguage-quicktips/quick-tip-65-number-of-bars-after-cross/
38
views
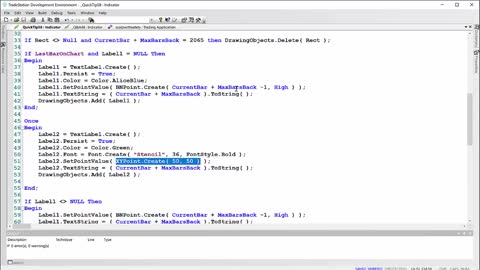
TradeStation EasyLanguage Quick-tip 50 | Find the lowest RSI and how many bars ago it occurred
Quick-tip 50 is an TradeStation EasyLanguage indicator, designed to look back a number of bars specified by user input: RSIMaxBarsBack, to find what the lowest value of RSI was (RSIMinValue) and how many bars ago it occurred (RSIMinBarsBack). The indicator plots the RSI value, RSIMinValue, and RSIMinBarsBack. It works on charts and RadarScreen.
Because the calculation of RSI is an accumulative calculation it is important to load sufficient data. On the chart this is done by setting how much history to load. In RadarScreen it is achieved by using the “Load additional data for accumulative calculations” setting. For the RSI calculation, TradeStation recommends a smoothing factor of 9.5 multiplied by the RSI length, in this case the user input RSILength.
Make sure that the chart is set to local time and the indicator is set to update value intra-bar.
Gold Pass members may download the program below. This Quick-tip is for TradeStation and MultiCharts users.
See https://markplex.com/free-tutorials/tradestation-easylanguage-quicktips/quick-tip-50-find-the-lowest-rsi-and-how-many-bars-ago-it-occurred/
30
views
Quick-tip 58 | Drawing object tactics
A TradeStation EasyLanguage quick tip that demonstrates:
1. How to keep a text object at a specific position as the chart updates
2. How to draw and delete a rectangle.
3. How to maintain and update a text object on the last bar of a chart
See https://markplex.com/free-tutorials/tradestation-easylanguage-quicktips/quick-tip-58-drawing-object-tactics/
25
views
Tutorial 170 | Looking for a chart pattern on several symbols using PSPs
Tutorial 170 demonstrates how multiple symbols can be loaded on a chart by using several price series providers (PSPs) to test for a specific condition (in this example a simple hammer pattern).
With tutorial 170 a list of stocks is stored in a text file stored on the local computer. This file is read into the program using the StreamReader and the names of the stocks stored in a TokenList after having been checked by another method that they are a valid symbol. Once the data has been downloaded a loop creates a PSP for each symbol in turn. The PSPs are stored in a vector. Update and state changed events are also created for each PSP.
Tutorial 170 monitors the state changed and update events for each PSP. When the PSP is first loaded and when each PSP closes, it performs a calculation to see if a simple candlestick pattern has occurred.
See https://markplex.com/tutorial-170-looking-for-a-chart-pattern-on-several-symbols-using-psps/ for full details.
23
views
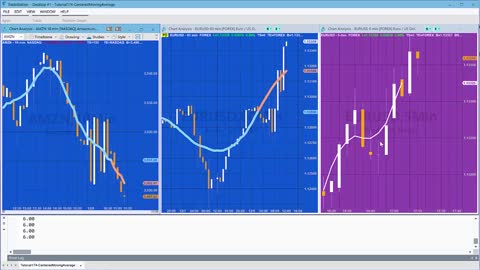
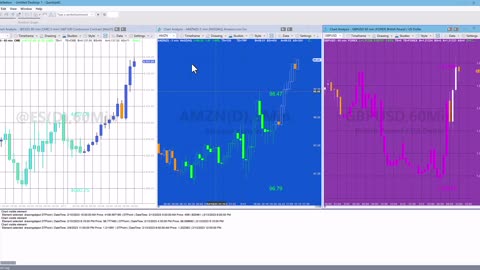
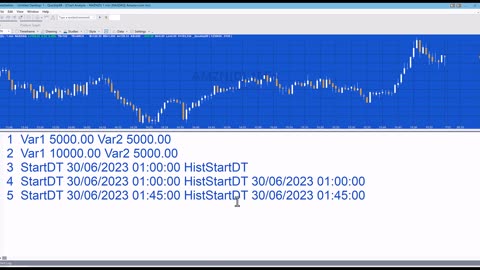
Tutorial 174 | Markplex Centered Moving Average
Tutorial 174 demonstrates how to write Markplex’s version of the Centered Moving Average (C) using TradeStation EasyLanguage. A centered moving average is placed at the center of the range rather than the end of it. This positions the moving average values at their central positions in time and is easy to accomplish by using EasyLanguage’s displace capability.
A disadvantage of the C is that because the values are displaced there are a number of bars at the end of the chart where there are not a sufficient number of future bars to calculate the average, by definition.
This tutorial demonstrates one approach to estimating the average for the last bars by replacing “missing” bars with the Close of the last bar and then re-calculating and re-plotting the last few bars whenever the close is updated.
https://markplex.com/free-tutorials/tutorial-174-markplex-centered-moving-average/
18
views
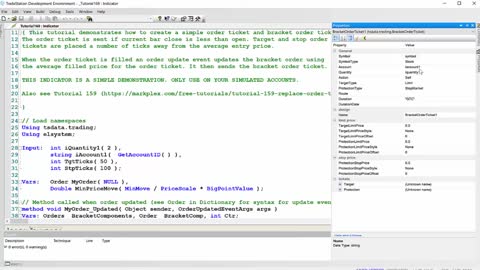
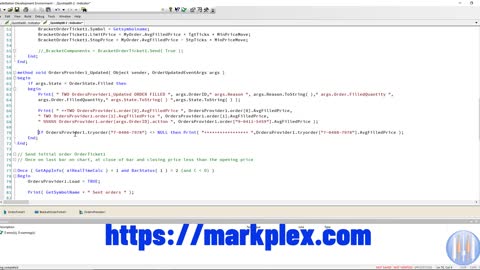
Tutorial 169 | Order ticket and bracket ticket for TradeStation EasyLanguage
Tutorial 169 demonstrates how to create a simple order ticket which is sent when the close of the bar is less than the open of the bar. When the initial order ticket is filled the program then issues a bracket order ticket that includes a target and stop. In order to send the bracket order the program uses an update event for the order generated from the order ticket.
In the simple scenario demonstrated in this tutorial, when the order ticket is filled the order update event updates the bracket order using the average filled price for the order ticket. It then sends the bracket order ticket. For the order placement objects to work the ‘enable order placement objects’ must be selected in the format indicator’s general tab.
If the tutorial program is reapplied to a chart or the chart refreshed, it will resend the order tickets. Use on your simulated account.
This tutorial only applies to TradeStation.
https://markplex.com/free-tutorials/tutorial-169-order-ticket-and-bracket-ticket/
16
views
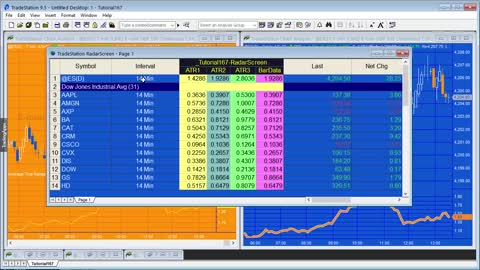
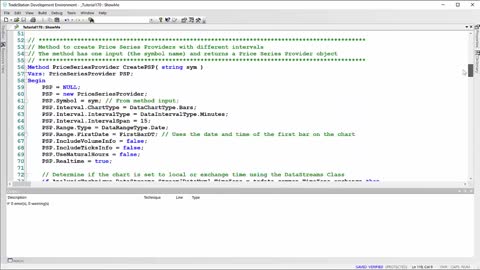
Tutorial 167 | Using a Price Series Provider to calculate the Average True Range | Part 2
Tutorial 167 is a TradeStation EasyLanguage tutorial that demonstrates how to calculate the Average True Range (ATR) using a Price Series Provider (PSP).
The technique could be used, for example, to calculate the ATR for a 9 minute interval span, but applied to a 5 minute chart.
In this video I use syntax from _Tutorial 167 to create new program (_Tutorial167-RadarScreen). In this program three PSPs are used to calculate three ATRs each with a different bar intervals. Each interval length is controlled by a user input: IntSpan1, IntSpan2, and IntSpan3. This program is applied to Radarscreen.
See https://markplex.com/tutorial-167-using-a-price-series-provider-to-calculate-the-average-true-range/
15
views
EasyLanguage quick-tip 82 | 'selecting' bars using a drawing tool
TradeStation EasyLanguage Quick-tip 82 uses a paint bar study to detect when the user has drawn a rectangle on the chart to 'select' bars. It plots the consecutive bars indicated by the rectangle and calculates the high and low values of the range. These values are added to the chart as text objects.
The quick-tip uses the same technique used in tutorial 188 to select bars. This quick-tip does not do the volume analysis.
See https://markplex.com/free-tutorials/tradestation-easylanguage-quicktips/quick-tip-82-selecting-bars-using-a-paintbar-study/
19
views
Quick-tip 88 | DateTime behavior | TradeStation EasyLanguage tutorials and programs
Quick-tip 88 demonstrates a behavior of the TradeStation DateTime object. In particular it looks at how you could save the temporary value of a DateTime object into another DateTime object using the Value property.
See https://markplex.com/free-tutorials/tradestation-easylanguage-quicktips/quick-tip-88-save-a-datetime-object-into-another-datetime-object/
19
views
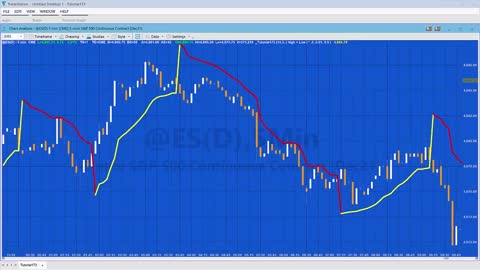
Tutorial 173 | Markplex Tradestation EasyLanguage SuperTrend
Tutorial 173 | SuperTrend indicator is a stop and reverse (SAR) indicator that trails price action. This implementation calculates the Average True Range (ATR) of the average price using the exponential moving average. A user input multiple of the ATR is added to or subtracted from the average price to give Upper and Lwr respectively, depending on the direction. Direction is determined by the Close of a bar relative to the value of the SuperTrend.
When the direction is up (Dir = 1), the SupTrend value can only increase. When the direction is down, the SupTrend can only decrease.
There are many different interpretations of the so-called SuperTrend indicator. In this Markplex version the SuperTrend value is also tightened (i.e. moved closer to price) by using an acceleration factor which increases incrementally each bar by user input: AFStep up to a a maximum value of user input: MaxAF.
The indicator works best in trending markets but gets 'whipsawed' in other markets.
See https://markplex.com/free-tutorials/tutorial-173-markplex-supertrend/
12
views
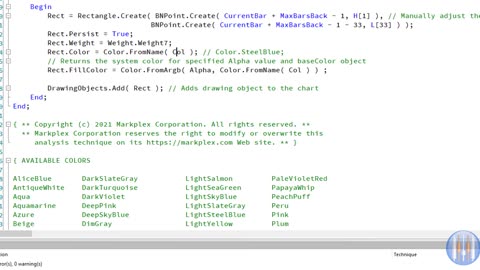
Quick-tip 67 | Change alpha value of a color in TradeStation EasyLanguage
QuickTip67 is a TradeStation EasyLanguage indicator that demonstrates how to change the alpha value of a color input as a string. The EasyLanguage indicator draws a rectangle when it is first applied to the chart. It colors the fill (using the string input: Col). The alpha value is changed based on the integer input: Alpha. The color of the rectangle itself (the outline) is colored based on the same color input (using the string input: Col) except it is fully opaque.
This technique was used in Tutorial 176: https://markplex.com/free-tutorials/tutorial-176-blend-bar-study/
and in Tutorial 156: https://markplex.com/free-tutorials/tutorial-156-import-data-in-csv-file-and-draw-it-on-a-chart/
Go to the quick-tip page here: https://markplex.com/free-tutorials/tradestation-easylanguage-quicktips/quick-tip-67-alpha-value-of-a-color-input/
15
views
Quick-tip 68 | Part 2 | Identifying and printing order information
In the second video two slightly modified versions of the program are applied to the chart. Information about both trades are displayed by using the order indexes. The video also shows how to get order information using a specific order identification code.
https://markplex.com/quick-tip-68-identifying-what-order-was-filled/
11
views
Tutorial 165 | Creating to a button to stop a strategy making trades
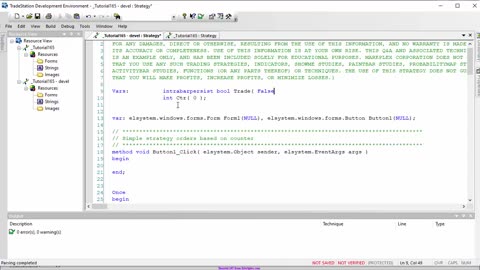
Tutorial 165 looks at how a strategy can be paused without changing the status of a strategy applied to real-time bars on a chart. In this tutorial the demo strategy is paused from generating trades by the click of a button.
The simple 'dummy' strategy in the tutorial generates market orders based on a counter. A condition for an order to take place is when the Boolean variable 'Trade' is set to TRUE. The Boolean variable is switched between true and false by clicking a button.
The tutorial demonstrates how to create a simple form and button. It also shows how to create and use a button click event. The form and button are initially created using the 'Add Form' capability and then using the visual design tools. Once the code is created it is copied from the 'Designer Generated Code' area into a strategy. The form is then deleted from the 'Resource View.'
See https://markplex.com/free-tutorials/tutorial-165-creating-to-a-button-to-stop-a-strategy-making-trades/
10
views
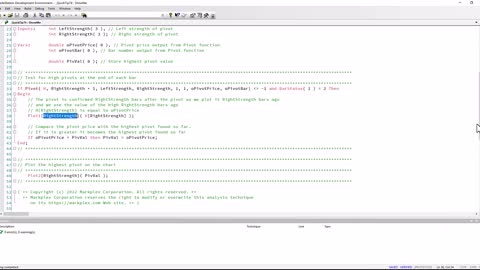
QuickTip 74 | Finding the highest pivot on a chart | TradeStation EasyLanguage tutorials
Quicktip 74 demonstrates a TradeStation EasyLanguage show-me study that finds the highest pivot on a chart. The quicktip analyses each bar to check whether it is a high pivot and then checks whether this newly found pivot price is higher than the highest pivot price found so far. This value is plotted each bar.
Quicktip 74 is related to tutorial 182 except that it looks for highest pivot on the chart. Tutorial 182 calculates the pivot with the highest value WITHIN a user input number of bars of the current bar (user input: LookbackBars). (N.B. This is different from finding the highest pivot value on the chart.) Each time a pivot is found it is plotted. In tutorial 182 the bar number and the price level are stored in a dictionary.
For more information about this quick-tip see: https://markplex.com/free-tutorials/tradestation-easylanguage-quicktips/quicktip-74-finding-the-highest-pivot-on-a-chart/
For more information about tutorial 182 see: https://markplex.com/tutorial-182-highest-pivot-within-user-input-number-of-bars/
17
views
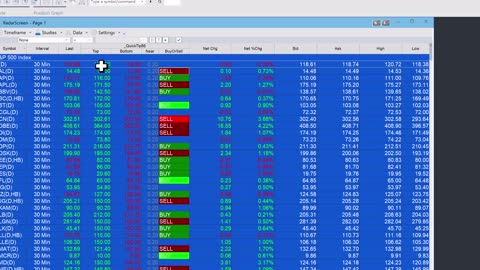
Quick-tip 86 | Basic TradeStation RadarScreen screener | EasyLanguage tutorials and programs
Quick-tip 86 demonstrates a simple indicator for TradeStation Radarscreen that has 3 columns: 3 input columns and one column that displays “buy” or “sell” depending on the price of the last trade.
The user inputs a “top” price, a “bottom” price and an adjustment amount (input: Near).
A further column displays "BUY" or "SELL" depending on the last price and the user inputs.
11
views
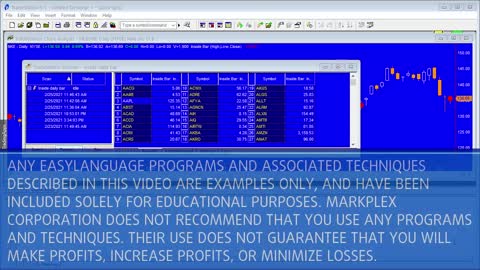
Quick-tip 52 | Using the TradeStation scanner during the formation of a bar
Quick-tip 52 uses the standard TradeStation EasyLanguage Inside Bar show me study to demonstrate that the scanner only analyzes completed bars. The showme study is run before the market opens, while the market is open and then after its close.
See https://markplex.com/free-tutorials/tradestation-easylanguage-quicktips/quick-tip-52-using-the-tradestation-scanner-during-the-formation-of-a-bar/ for more information.
10
views