Tutorial 180 | Text Objects Basics | Part 1
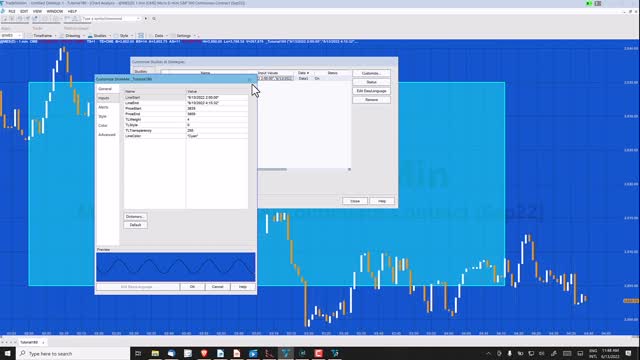
TradeStation EasyLanguage Tutorial 180 demonstrates how to draw a line, a rectangle and a text label by specifying a start date, time and price and an end date, time and price. The times can be specified to the second. The tutorial uses Parse method of the DateTime class to convert user input strings (in mm/dd/yyyy hh:mm:ss format) into DateTime objects. These values are combined with user input prices to create DTPoint objects using DTPoint.Create. These DTpoints are then used to create a trendline, a rectangle and a text label.
Additional functionality is included so that the rectangle is drawn even if the end date time is not currently visible on the chart. This is achieved by checking the current BarDateTime at the beginning of each bar. If it is less than the LineEndTime then the rectangle has its end time set to the most right display datetime. This is repeated as each new bar is added to the chart, until the bar DateTime is equal to or greater than the end time.
Technical lessons covered in this tutorial include:
– Drawing lines, rectangles and text objects
– Using DateTime.Parse to convert a string to a DateTime object
– Using methods to create and update drawing objects
– Using ‘Composite Formatting’ to print data
– Ensuring a rectangle is visible even if the end datetime is not currently on the chart
This tutorial does not work with MultiCharts.
https://markplex.com/free-tutorials/tutorial-180-text-objects-basics/
-
 19:06
19:06
EEVblog Channel
3 years agoEEVblog 1469 - AC Basics Tutorial - Part 2 - Phasors
40 -
 24:27
24:27
EEVblog Channel
3 years ago $0.01 earnedEEVblog 1470 - AC Basics Tutorial Part 3 - Complex Numbers are EASY!
50 -
 4:57
4:57
govvit
4 years agoÁcido Cítrico | Gangplank Tutorial Part 1 - The Basics
6 -
 1:11:07
vivafrei
3 hours agoFishing for Lawsuits! I Get Blocked Because Zohran is Anti-Gay? Halloween Terror Plot & MORE!
85.9K29 -
 1:12:46
Russell Brand
5 hours agoWE’RE BACK! The Fight for Freedom Starts NOW - SF645
81.3K76 -
 1:07:56
The Quartering
4 hours agoBen Shapiro Vs Tucker Carlson, Blackface Trick Works, Kash Patel Under Fire, Based Woman Vs Trans
69K30 -
 1:35:28
The HotSeat With Todd Spears
3 hours agoEpisode 202: Ladies it's YOUR Battle too!
12.9K13 -
 1:24:44
DeVory Darkins
5 hours agoTrump dominates 60 minutes interview as Democrats surrender to Mamdani
127K43 -
 7:29
7:29
China Uncensored
7 hours agoThey’re Beautiful. They’re Dangerous. They Work for the CCP.
12.3K16 -
 1:50:43
Tucker Carlson
5 hours agoChris Williamson’s Advice to Men: How to Survive a World of OnlyFans and AI Girlfriends
81.4K80