Premium Only Content

Tutorial 180 | Text Objects Basics | Part 2
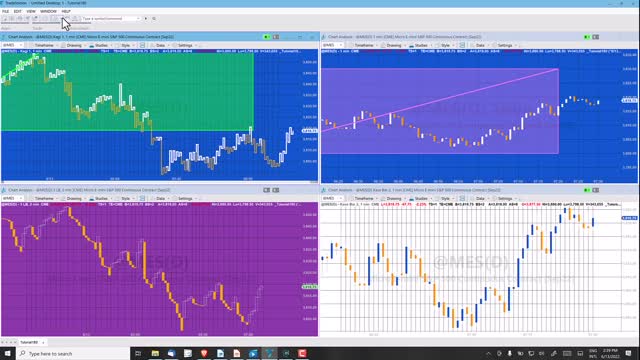
TradeStation EasyLanguage Tutorial 180 demonstrates how to draw a line, a rectangle and a text label by specifying a start date, time and price and an end date, time and price. The times can be specified to the second. The tutorial uses Parse method of the DateTime class to convert user input strings (in mm/dd/yyyy hh:mm:ss format) into DateTime objects. These values are combined with user input prices to create DTPoint objects using DTPoint.Create. These DTpoints are then used to create a trendline, a rectangle and a text label.
Additional functionality is included so that the rectangle is drawn even if the end date time is not currently visible on the chart. This is achieved by checking the current BarDateTime at the beginning of each bar. If it is less than the LineEndTime then the rectangle has its end time set to the most right display datetime. This is repeated as each new bar is added to the chart, until the bar DateTime is equal to or greater than the end time.
Technical lessons covered in this tutorial include:
– Drawing lines, rectangles and text objects
– Using DateTime.Parse to convert a string to a DateTime object
– Using methods to create and update drawing objects
– Using ‘Composite Formatting’ to print data
– Ensuring a rectangle is visible even if the end datetime is not currently on the chart
This tutorial does not work with MultiCharts.
https://markplex.com/free-tutorials/tutorial-180-text-objects-basics/
-
 LIVE
LIVE
Donald Trump Jr.
2 hours agoThe China Matrix with Journalist Lee Smith | TRIGGERED Ep.288
8,932 watching -
 LIVE
LIVE
BonginoReport
1 hour agoNicki Minaj Speaks Out Against Christian Persecution - Nightly Scroll w/ Hayley Caronia (Ep.169)
2,097 watching -
 LIVE
LIVE
Kim Iversen
2 hours agoTrump’s Nigeria Threat Isn’t About Christians — It’s About China
5,168 watching -
 LIVE
LIVE
Sean Unpaved
1 hour agoDodgers Dynasty Rolls On, NFL Chaos Reigns, & MNF Showdown Countdown
81 watching -
 1:35:56
Redacted News
2 hours agoA MAGA Civil War has just begun, Christians slaughtered in Nigeria, Charlie Kirk's audiit | Redacted
85.5K99 -
 LIVE
LIVE
Dr Disrespect
7 hours ago🔴LIVE - DR DISRESPECT - ARC RAIDERS - FULL SEND INTO THE RED
1,659 watching -
 26:34
26:34
Stephen Gardner
2 hours ago🔥Elon EXPOSES The Exact Blueprint Dems use to CHEAT on Joe Rogan!!
16.8K64 -
 51:10
51:10
Dad Saves America
6 hours ago $0.36 earnedMask Off Mamdani: NYC’s Socialist “Savior” Is Another Spoiled Aristocrat
3.63K3 -
 6:14
6:14
Buddy Brown
7 hours ago $1.61 earnedLaw Enforcement Caught SNOOPING on PRIVATE LAND! | Buddy Brown
4.66K11 -
 16:21
16:21
Real Estate
1 month ago $0.28 earnedIt’s Not Just You..NO ONE CAN AFFORD KIDS ANYMORE
3.99K6