

EasyLanguage Tutorial 196 | Scope in methods (plus convert a function to a method) | Part 1
Tutorial 196 gives an example of “scope” in the context of a method.
A common guideline in good programming practice suggests that a method should ideally only utilize variables that are provided through its parameter list or those that are locally declared within the method itself. However, there are situations where adhering strictly to this principle might be overly cumbersome or impractical. In such cases, it becomes possible to reference variables that have been declared at a the EasyLanguage study level.
Both “types” of methods are demonstrated in this tutorial.
When a variable is declared within the primary section of a study, it can be directly accessed and modified throughout that study. Nevertheless, when a method is invoked, it operates within its designated scope by design. This means that a variable declared within a method is confined to that method’s scope. Even if a variable with an identical name exists elsewhere, it is treated as a distinct and separate entity, maintaining its own distinct scope within the method.
To demonstrate converting the functions to methods two functions are used:
XAverage (a series function), and
Average( a simple function)
See https://markplex.com/free-tutorials/tutorial-196-scope-in-methods-plus-convert-a-function-to-a-method/
3
views
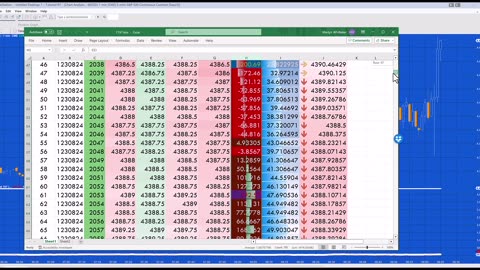
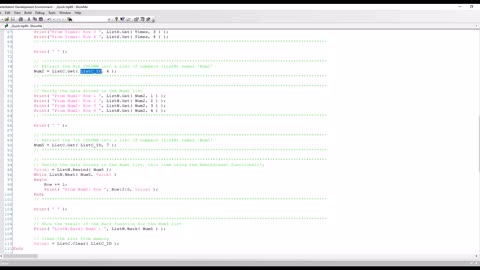
Tutorial 197 | Storing bar and analysis technique data in Excel
A Gold Pass member asked how to create an Excel spreadsheet with n rows and m columns, the n rows representing each of the successive bars on an intraday chart, and for each of the n rows a column for each of the m different indicator values that appear on that bar. In tutorial 197 the following data is stored for each successive bar: a bar counter, date , time, close, open, high, low, the value of the calculated CCI, the values of the calculated RSI and the average of the closing price. The values for the most recent bar are updated in real time.
When the program is restarted it reopens and rewrites the data.
The tutorial also touched upon the use of the Microsoft Excel "Conditional Formatting" feature.
Other Excel integration tutorials include:
Tutorial 150 | Sharing data between two charts using Microsoft Excel
Tutorial 113 | Using data from an Excel sheet to update an EasyLanguage program
Tutorial 112 | Transfer price data from a Price Series Provider applied to a chart to an Excel spreadsheet
Tutorial 96 | Using the Workbook component to share information with Excel
14
views
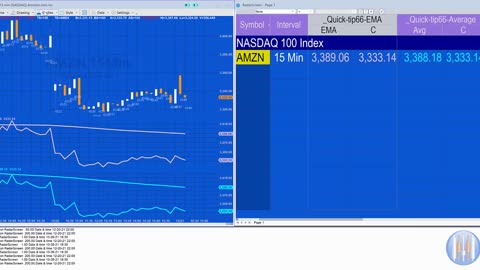
Quick-tip 66 | Why the values from a study on my Radarscreen are different from those on a chart?
Quick-tip 66 explains why sometimes studies applied to RadarScreen can give different values from the same study applied to a chart with the same settings, and vice-versa and how to avoid this.
To demonstrate quick-tip 66 uses an exponential moving average (EMA) and a simple moving average applied to both chart and Radarscreen.
See https://markplex.com/quick-tip-66-why-the-values-from-a-study-on-my-radarscreen-are-different-from-those-on-a-chart/
1
view
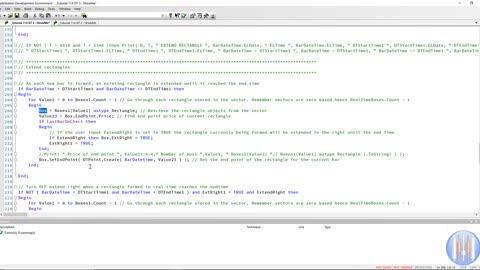
TradeStation EasyLanguage tutorial 114 DT 3 | Draws boxes between two start and end times each day
_Tutorial 114 DT 3 draws boxes between two start and end times each day. If a chart does not have a bar with a specific time stamp corresponding to the start time the box will be drawn from the following bar. Similarly, if the chart does not have a bar corresponding to the end time, the box will be drawn to the following bar.
Drawing boxes might be useful if you wished to highlight trading activities and levels between certain times. Alternatively, although the times and price levels in this program are specified as user inputs, you could use the techniques built into this tutorial in a more sophisticated program that calculated levels.
The tutorial program uses the rectangle class with several of its properties and the create class. The tutorial demonstrates the creation of a method to create the rectangles, which is called from several places in the program. Tutorial 114 DT 3 creates five boxes at different price levels in each time zone..
A user input (ExtendRight) determines whether a box that is currently under development for real time bars is extended to the right or just extended to the current bar (until the end time is reached).
TradeStation EasyLanguage technical lessons
In the tutorial video and the program comments you will learn:
- How to write a method with several inputs
- How to use the rectangle class
- How to create a DT (DateTime) point
- How to extend the rectangles to the right
- Setting the end point of a rectangle
- How to vary the transparency of the rectangles
- How to draw historic and future rectangles on historic and real-time bars
- Specifying and using time to seconds accuracy
- Converting EasyLanguage legacy date and time into DateTime objects
- Dealing with start and end times that start in one day and end in the next
The program is available for download for a small fee or for FREE to Gold Pass members.
Version 3 is a simplified and improved version of the original programs that has been tested in TradeStation 10.0.
See https://markplex.com/free-tutorials/tutorial-114-dt-drawing-rectangles-chart-time-periods-day/
6
views
Tutorial 182 | Highest pivot within user input number of bars
Tutorial 182 demonstrates a EasyLanguage Show-me study that calculates the pivot with the highest value WITHIN a user input number of bars of the current bar (user input: LookbackBars). (N.B. This is different from finding the highest pivot value on the chart.) Each time a pivot is found it is plotted. The bar number and the price level are stored in a dictionary.
At the end of each bar the dictionary is traversed and index/values pairs where the pivot occurred more than user input LookBackBars ago are deleted. The dictionary values are then copied into a vector (named Values) which is sorted to find the highest value using the Markplex _VectorQuickSort function. This value is plotted.
More information about the _VectorQuickSort function, which uses a recursive method can be found at: https://markplex.com/free-tutorials/t...
The tutorial program and the _VectorQuickSort function are available for download at no cost to Gold Pass members.
This tutorial does not work with MultiCharts.
1
view
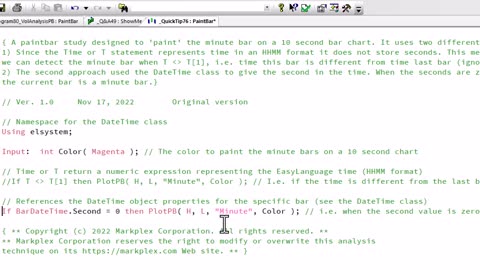
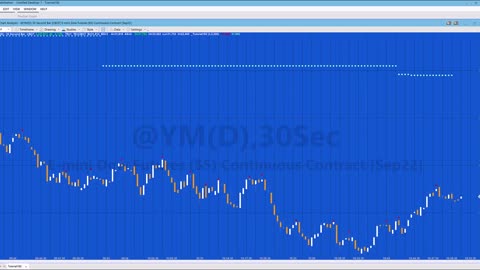
QuickTip 76 | Painting the minute bar on a 10 second bar chart | TradeStation EasyLanguage
QuickTip 76 is a paintbar study designed to 'paint' the minute bar on a 10 second bar chart. It uses two different approaches:
1) Since the Time or T statement represents time in an HHMM format it does not store seconds. This means that we can detect the minute bar when T Not Equal toT[1], i.e. time this bar is different from time last bar (ignoring seconds).
2) The second approach used the DateTime class to give the second in the time. When the seconds are zero it means that the current bar is a minute bar.
https://markplex.com/free-tutorials/tradestation-easylanguage-quicktips/quicktip-76-painting-the-minute-bar-on-a-10-second-chart/
1
view
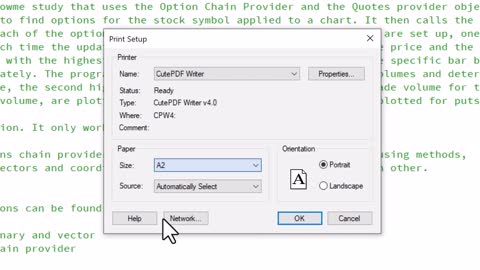
Quick-tip 77 | Printing programs and avoiding unwanted word-wrap
You may have noticed that when you print a program you sometimes get long lines of code split into multiple lines in order to fit on the paper (depending on the font size you use and the size of paper etc). This can make the program difficult to read.
This quick-tip demonstrates how to print a program to a PDF file while avoiding word-wraps (depending on the size of the line of code being printed.)
The quick-tip uses software from https://www.cutepdf.com/index.htm.
https://markplex.com/free-tutorials/tradestation-easylanguage-quicktips/quicktip-77-printing-a-pdf-of-a-program-without-word-wrap/
1
view
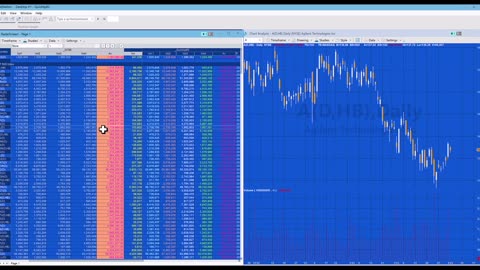
Quick-tip 85 | Average daily volume on non daily bar type
I was asked how to show a daily average on a non daily interval for RadarScreen. For example, you might have a 5 minute bar interval but you want to show the average of volume for the last 5 days.
This quick-tip demonstrates how this can be achieved using the TradeStation price series provider.
See the quick tip page here: https://markplex.com/free-tutorials/tradestation-easylanguage-quicktips/quick-tip-85-average-daily-volume-on-non-daily-bar-type/
Gold Pass members can download the program for free on the quick-tip page (above).
1
view
Quick-tip 89 | Importing a text file into ELCollections
Collections for EasyLanguage is a versatile and powerful programming feature that allows TradeStation EasyLanguage to manage and manipulate groups of data efficiently.
_Quick-tip 89 explains how to import a comma delimited text file into an ELCollections collection of lists. In this example the lists include list of numbers and lists of strings. The quick-tip also demonstrates ways of accessing the data once the text file has been imported.
See https://markplex.com/free-tutorials/tradestation-easylanguage-quicktips/quick-tip-89-importing-a-text-file-into-elcollections/
2
views
EasyLanguage Tutorial 196 | Scope in methods (plus convert a function to a method) | Part 2
Tutorial 196 gives an example of “scope” in the context of a method.
A common guideline in good programming practice suggests that a method should ideally only utilize variables that are provided through its parameter list or those that are locally declared within the method itself. However, there are situations where adhering strictly to this principle might be overly cumbersome or impractical. In such cases, it becomes possible to reference variables that have been declared at a the EasyLanguage study level.
Both “types” of methods are demonstrated in this tutorial.
When a variable is declared within the primary section of a study, it can be directly accessed and modified throughout that study. Nevertheless, when a method is invoked, it operates within its designated scope by design. This means that a variable declared within a method is confined to that method’s scope. Even if a variable with an identical name exists elsewhere, it is treated as a distinct and separate entity, maintaining its own distinct scope within the method.
To demonstrate converting the functions to methods two functions are used:
XAverage (a series function), and
Average( a simple function)
See https://markplex.com/free-tutorials/tutorial-196-scope-in-methods-plus-convert-a-function-to-a-method/
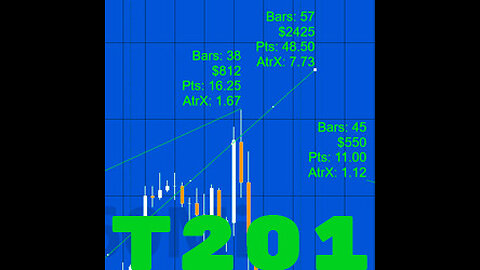
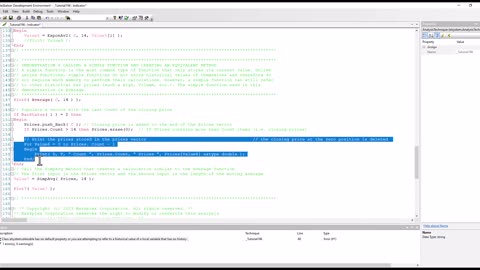
Tutorial 201 | Annotated trend line drawing tool
In tutorial 201 trendlines drawn on the chart are are analyzed and text is added to the chart, associated with the trendline. The contents of the text can include, either points value, dollar value, ATR multiple (before the trendline), number of bars or a combination of all this information depending on the setting of a user input: ShowValue.
The ATR value being shown is actually the multiples of ATR (calculated before the move) for the move, not the ATR value.
If the chart is refreshed the program recalculates the values based on the trendline objects that remain on the chart. This also occurs if MaxBarsBack is set to auto-detect. In this case, when a drawing object is added earlier on the chart to the current drawing objects, the chart recalculates.
If the lines are moved or either of the start or end positions are changed, the text label is updated.
The free download is available here: https://markplex.com/free-tutorials/tutorial-201-trend-line-drawing-tool/
Remember to subscribe to the Markplex email list at https://markplex.com