1 year agoExcel Arrow Variance Chart: Dynamic Arrows in Chart to Show Change to Previous Year / BudgetLeila Gharani
1 year agoHolding the Line - A Parable of America | Pastor Jared Pozarnsky, Hold Fast Baptist ChurchHard Preaching
1 year agoOptimized Excel Line Charts: Prevent drop to zero & dynamic Legend positioningLeila Gharani
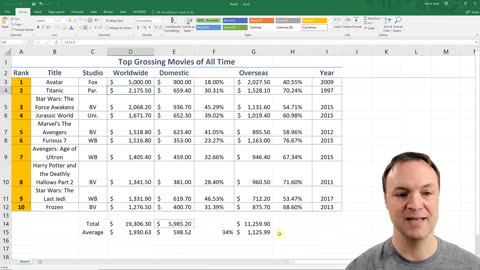
8 months agoMicrosoft Excel Tutorial for Beginners | Excel Training | FREE Online Excel courseCreative World
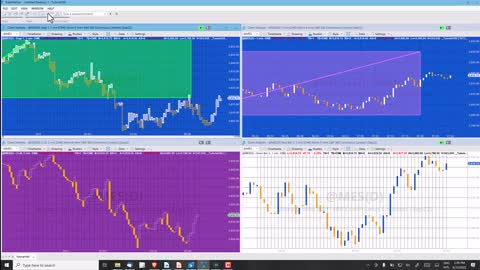
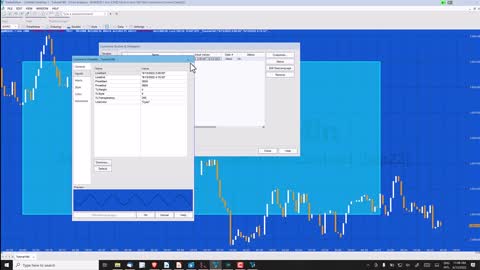
1 month agoquotLast domain does not have enough data columnsquot when combining Candlestick and Line chart forTechSphere
2 years agoLove and Tears (New recording/master and Video) by Darmin De'flernMusic Videos, tutorials, poems and prose.
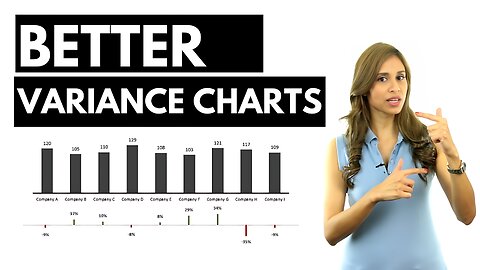
1 year agoBetter Excel Variance Charts to show percentage change (Simple & uncommon technique)Leila Gharani


![Bitcoin the line broke [price trap]](https://hugh.cdn.rumble.cloud/s/s8/1/J/y/s/t/Jysth.oq1b.2-small-Bitcoin-the-line-broke-pric.jpg)