Premium Only Content

USE QUICK ANALYSIS TOOL TO ANALYZE LIKE A CHAMP IN EXCEL
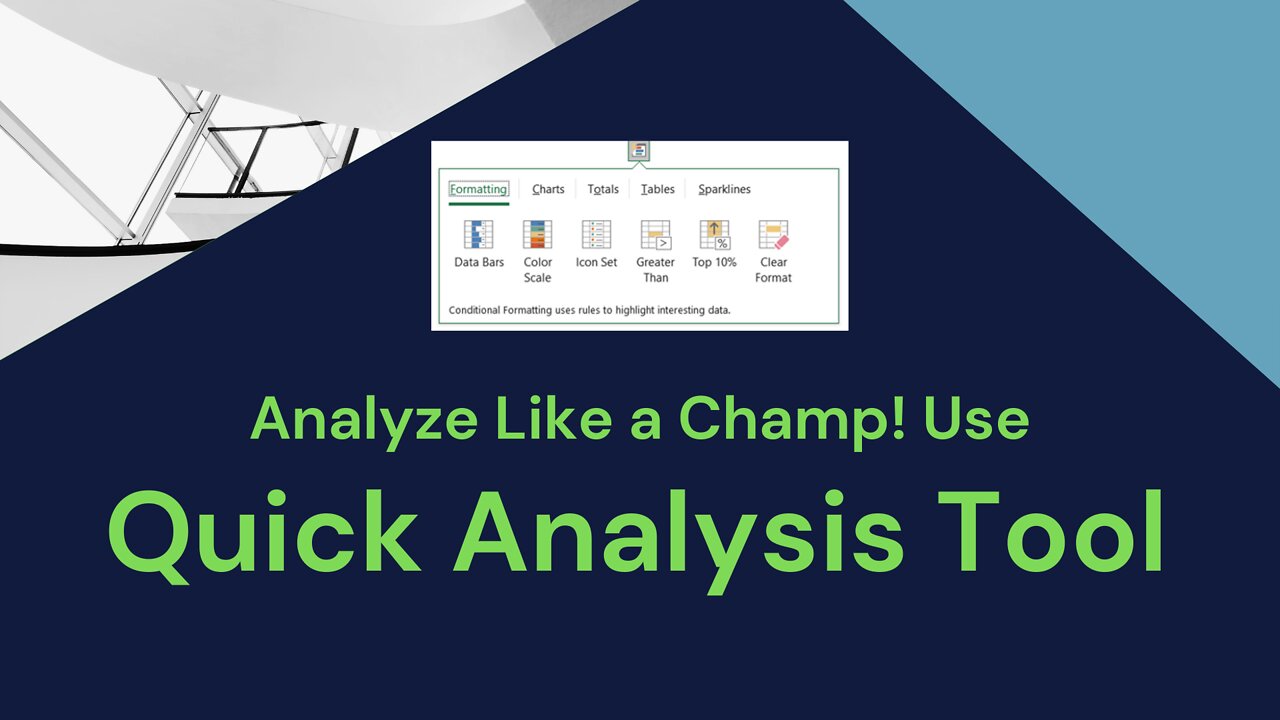
This video features the uses of Excel’s Quick Analysis Tool and illustrates how you can use it. This tool is like a Swiss Knife of data analytics filled with powerful tools to help you manage your data sets of any size. Here we can do quick formatting to add visual representation, and help identify distinct figures like the highest and the lowest. It includes charts, color coding and formulas.
Just one click of the Quick Analysis button uncovers the following tools to analyze or format your data:
• Formatting Tools
o Data Bars
o Color Scale
o Icon Set
o Greater Than
o Top 10%
• Charts
o Clustered Column
o Clustered Bar
o Line
o Pie
o Scatter
o Other Recommended Charts
• Totals (Rows and Columns)
o Sum
o Average
o Count
o % Total
o Running Total
• Tables
• Sparklines
All of those functions are in one button found at the bottom right corner of the highlighted data.
Title: Use Quick Analysis Tool to Analyze Like a Champ in Excel
#quickanalysistool #excelformatting #excelshortcuts #excelanalysis
-
 13:42
13:42
Nate The Lawyer
19 hours ago $3.07 earnedINSANE Judge REMOVED For Lying Under Oath, Insurance Fraud & Stolen Valor
10.3K14 -
 38:32
38:32
Code Blue Cam
1 day agoHow Police Stopped a Potential Church Massacre...
42.8K12 -
 24:26
24:26
Actual Justice Warrior
1 day agoWelfare Queens RAGE OUT Over Food Stamp Cuts
16.5K49 -
 3:05:11
Inverted World Live
11 hours agoThe Halloween Special with Drea De Matteo and Sam Tripoli | Ep. 133
365K16 -
 2:57:52
Laura Loomer
13 hours agoEP154: Naturalized US Navy Medic From GAZA Exposed For Ties To Hamas
50.2K29 -
 35:45
35:45
Stephen Gardner
16 hours ago🔴BREAKING: Election Auditor EXPOSES Democrat Election Fraud Evidence!
57.4K75 -
 15:48
15:48
Sponsored By Jesus Podcast
20 hours agoHow to Stop Being JEALOUS | When Comparison Steals Your Joy
24.8K13 -
 3:56:59
DLDAfterDark
11 hours ago $20.79 earnedDon't Worry - Things Will Get SO Much Worse! Sometimes It Be Like That
40.1K9 -
 25:41
25:41
Robbi On The Record
17 hours ago $5.08 earnedThe Billion-Dollar Lie Behind OnlyFans “Empowerment” (Her Testimony Will Shock You) | part II
26.9K18 -
 12:22
12:22
Cash Jordan
8 hours ago"CHICAGO MOB" Fights Back... "ZERO MERCY" Marines DEFY Judge, SMASH ILLEGALS
46.4K59