QUICK ANALYSIS TOOL TO ANALYZE LIKE A CHAMP IN EXCEL
This video features the uses of Excel’s Quick Analysis Tool and illustrates how you can use it. This tool is like a Swiss Knife of data analytics filled with powerful tools to help you manage your data sets of any size. Here we can do quick formatting to add visual representation, and help identify distinct figures like the highest and the lowest. It includes charts, color coding and formulas.
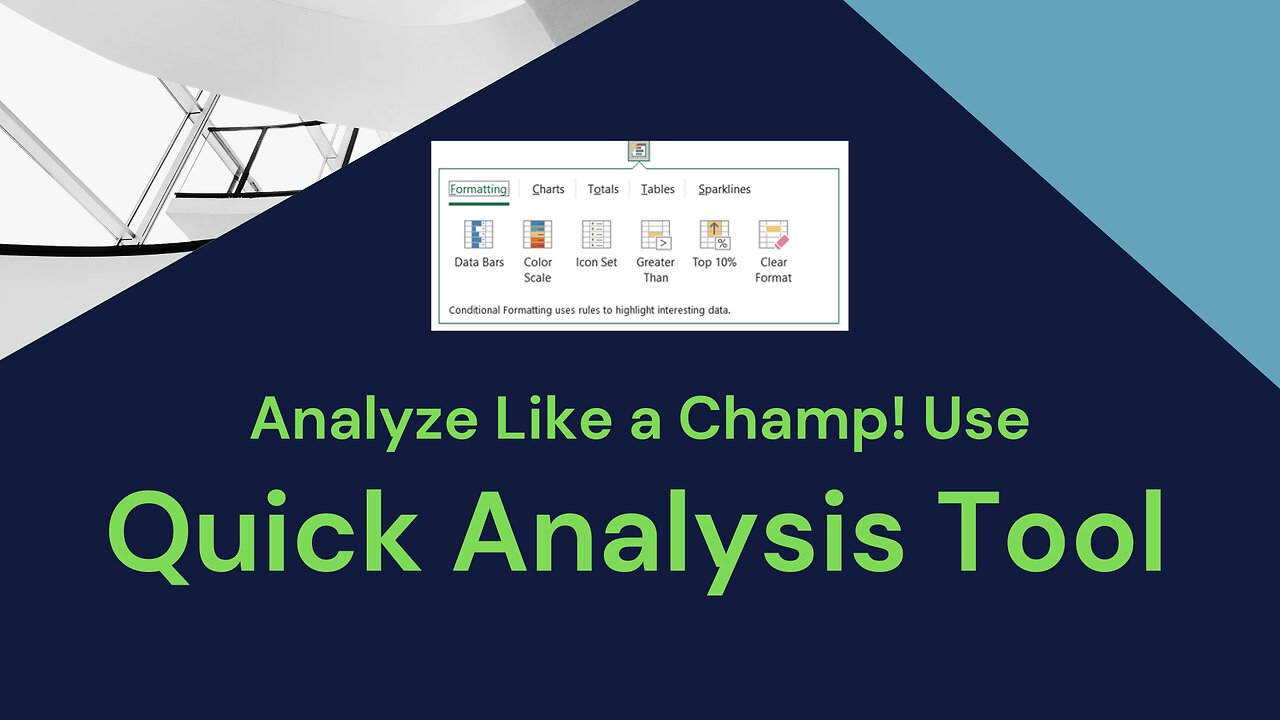
Just one click of the Quick Analysis button uncovers the following tools to analyze or format your data:
• Formatting Tools
o Data Bars
o Color Scale
o Icon Set
o Greater Than
o Top 10%
• Charts
o Clustered Column
o Clustered Bar
o Line
o Pie
o Scatter
o Other Recommended Charts
• Totals (Rows and Columns)
o Sum
o Average
o Count
o % Total
o Running Total
• Tables
• Sparklines
All of those functions are in one button found at the bottom right corner of the highlighted data.
Title: Use Quick Analysis Tool to Analyze Like a Champ in Excel
#quickanalysistool #excelformatting #excelshortcuts #excelanalysis
-
 LIVE
LIVE
Akademiks
1 hour agoMeg Thee Stallion Back LYING again? Offset vs Finesse2x. 6ix9ine house robbed.. HERES WHO DID IT
913 watching -
 LIVE
LIVE
SpartakusLIVE
2 hours agoFriday Night HYPE w/ YOUR King of Content
157 watching -
 LIVE
LIVE
Blabs Life
1 hour agoPeter Jackson's King Kong: The Official Game of the Movie | Noob Plays
87 watching -
 LIVE
LIVE
sim_n_shift
2 hours agoARC Raiders: Dropping Into the Chaos
91 watching -
 1:19:28
Kim Iversen
4 hours agoNetanyahu Reveals Yep, Epstein Worked For Israel
21.9K73 -
 1:55:00
Roseanne Barr
4 hours agoJovan Pulitzer Is Back! | The Roseanne Barr Podcast #124
179K100 -
 1:35:41
vivafrei
6 hours agoDemonizing Nick Fuentes into the Mainstream! Live with Jake Lang! Miranda Divine Guest & MORE!
84.5K115 -
 5:13
5:13
Buddy Brown
9 hours ago $5.43 earnedMuslim PATROL CARS Begin Monitoring NYC! | Buddy Brown
21.1K42 -
 12:54
12:54
MetatronGaming
5 hours agoYou Remember Super Mario WRONG and I can Prove it
26.8K8 -
 1:02:55
Russell Brand
6 hours agoThe Epstein Files Are Coming — And The Establishment Is Terrified! - SF653
102K14