11 months agoMicrosoft Excel: How to Improve your Charts & Tables for Better Communication - PromoLeila Gharani
11 months agoEasiest Excel Waterfall Chart (Bridge graph) from Scratch - Works with minus valuesLeila Gharani
1 month agoExcel Tutorial :: Top 10 Excel functions everyone needs to become an Excel PRO.GorgeousExcel
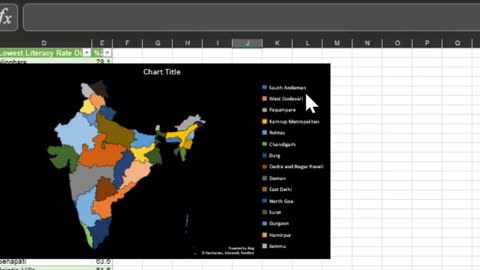
9 months agoSales Dashboard in Power BI | Power Bi | Excel | Power Point | Tutorial | Hindi/Urdu | (Part II)Space & Satellite Technology
11 months agoBetter Excel Variance Charts to show percentage change (Simple & uncommon technique)Leila Gharani