Premium Only Content

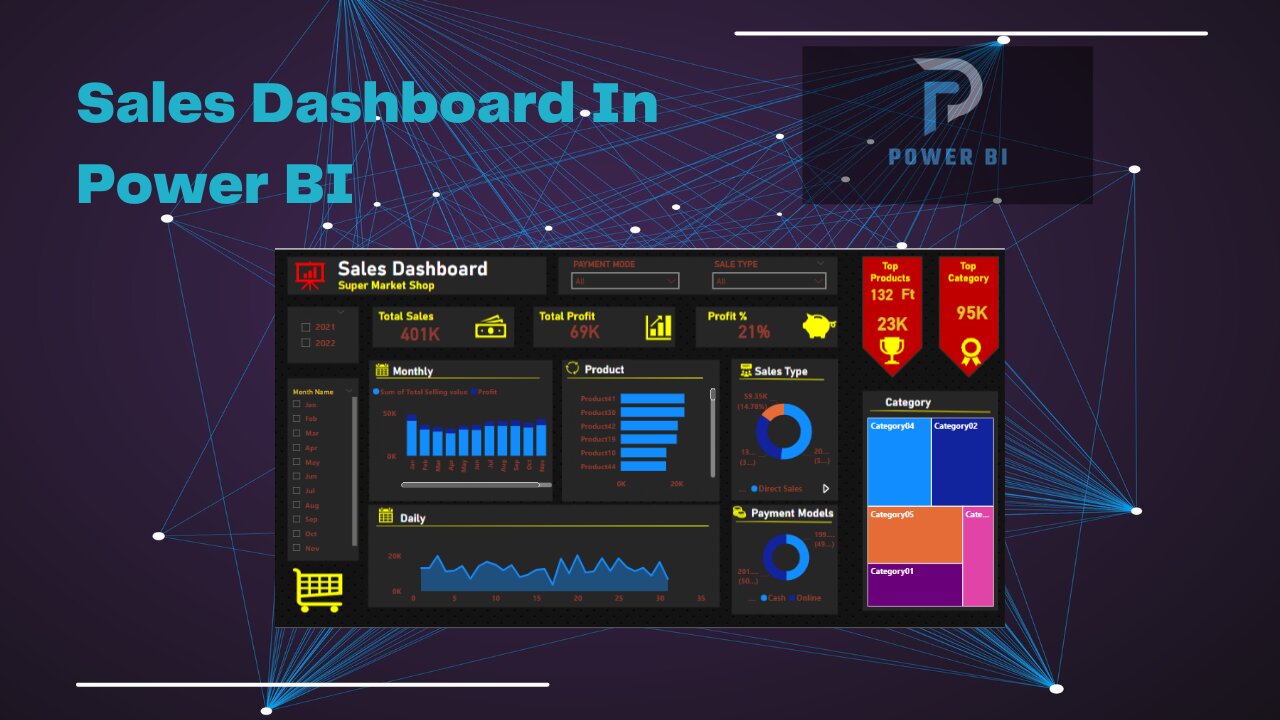
Sales Dashboard in Power BI | Power Bi | Excel | Power Point | Tutorial | Hindi/Urdu | (Part II)
Welcome to our beginner-friendly Power BI tutorial! 📊 In this step-by-step video, you'll learn how to create an impressive Sales Dashboard from scratch. Whether you're a business professional, analyst, or just curious about data visualization, this tutorial is perfect for you.
Importing data from Excel into Power BI
Creating engaging visualizations like bar charts, line graphs, and maps
Adding interactive filters to dynamically explore data
Incorporating KPIs to track business performance
Designing a sales trend chart for insightful analysis
Using geographic visualizations to showcase regional sales data
Implementing drill-through pages for in-depth exploration
Customizing dashboard layout and appearance
Sharing and publishing your dashboard with others
Don't miss out on mastering Power BI and creating stunning dashboards! Hit the like button 👍, subscribe for more tutorials, and let's dive into the exciting world of data visualization together. If you have any questions or suggestions, feel free to leave them in the comments below. Let's get started! 💡📈👩💼👨💼
#PowerBI #DataVisualization #DashboardTutorial #BeginnerGuide #SalesDashboard
-
 1:10:48
Chad Prather
9 hours agoPeace That Walks Through Walls: Finding Faith in a Fearful World
57.6K14 -
 LIVE
LIVE
LFA TV
12 hours agoLIVE & BREAKING NEWS! | TUESDAY 11/11/25
3,350 watching -
 8:27
8:27
MattMorseTV
16 hours ago $20.76 earnedIlhan Omar IMPLICATED in $250,000,000 FRAUD RING.
37.2K138 -
 1:58:13
The Chris Salcedo Show
13 hours ago $4.71 earnedOur Vets Fought To Turn Over Our Country To Marxists & Leftists?
14.5K1 -
 15:11
15:11
Cash Jordan
17 hours agoIllegals ‘Force Out’ NYC Millionaires… "Communist" Mayor FREAKS as RESIDENTS LEAVE
41.7K30 -
 43:03
43:03
RiftTV
9 hours agoLeftists Scheme To Destroy the Economy | Guest: Brad Miller | DC Dive
30.5K5 -
 6:52
6:52
ThinkStory
17 hours agoThe INSANE Pennywise Daughter Theory - IT: Welcome to Derry
22.8K -
 7:49
7:49
Blackstone Griddles
15 hours agoEasy Weeknight Meals: Southwest Patty Melt
24.8K -
 52:51
52:51
A Cigar Hustlers Podcast Every Day
1 day agoEpisode 2 Hustler Every Day
19.2K -
 LIVE
LIVE
FyrBorne
4 hours ago🔴Battlefield 6 Live M&K Gameplay: Assault Might Actually Be OP In REDSEC
117 watching