5 months agoUnlocking Insights: The Power of Data Visualization in Customs BrokerageLicense To Import
2 years agoJust Show Me the Data! Part 2: How Mandates Superseded Supporting EvidenceHood River Story Report
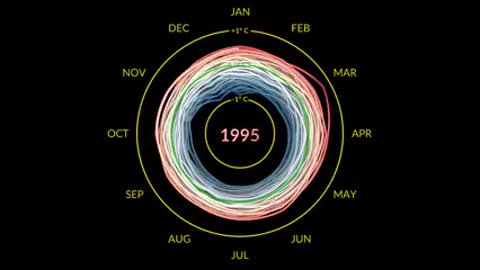
1 year agodon't likes graphs? this new visualization show monthly global temperature anomalies.majidelahi123
2 years agoNewsbreak 146: Albert Benavides, Dr. Young: Faulty Reports at CDC VAERS Hides Depth of Vaccine CrimeDrRobertYoung
1 year agoBetter Excel Variance Charts to show percentage change (Simple & uncommon technique)Leila Gharani
2 years agoNewsbreak 146: Albert Benavides, Dr. Young: Faulty Reports at CDC VAERS Hides Depth of Vaccine CrimeRamola D Reports
1 year agoChatGPT 4 - Create Beautiful Graphs And Charts In Seconds - NO EXCEL REQUIRED - Daigr.amAI Solutions