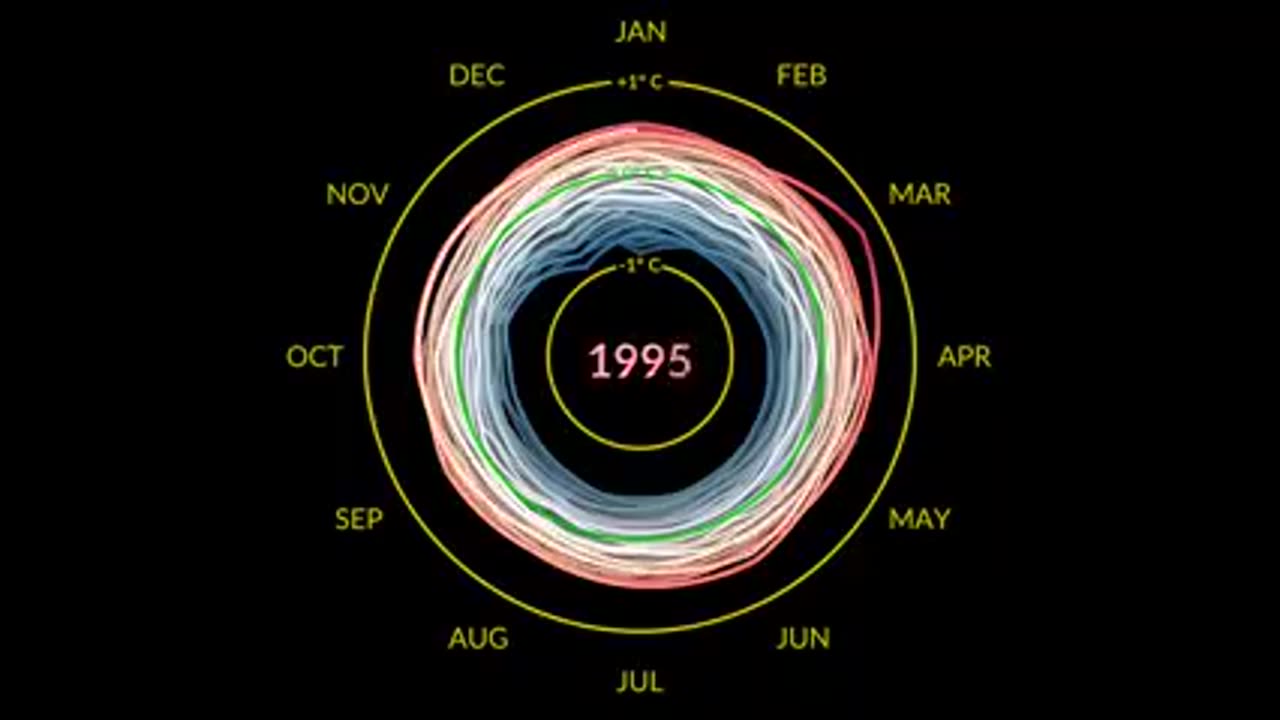
don't likes graphs? this new visualization show monthly global temperature anomalies.
Loading comments...
-
 21:32
21:32
Doc Rich
18 hours agoThis Has Gotten Out Of Control
1372 -
 58:25
58:25
SinCityCrypto
17 hours agoAltcoin Run Begins (Ethereum EXPLOSION Coming)
732 -
 3:57
3:57
Michael Knowles
13 hours agoIs President Trump SERIOUSLY Sick?!
7.92K5 -
 1:58:30
MG Show
18 hours agoThe Creation of the Russia Hoax; Anon’s Have Had it All
27.8K12 -
 40:31
40:31
Homesteading Family
2 days agoReducing Summer Pest Pressure in the Garden (The Easy Way)
8.78K3 -
 34:27
34:27
SLS - Street League Skateboarding
4 days agoRayssa Leal SHOWED OUT for the Brasilia Fans 👏 | SLS Brasilia Women's Final Highlights
12.9K -
 7:16
7:16
Blackstone Griddles
11 hours agoLeftover Steak Roll-ups on a Blackstone Griddle
3.39K1 -
 14:32
14:32
Dr. John Campbell
2 days agoWHO Trojan Horse
19.9K58 -
 36:54
36:54
SB Mowing
3 days ago5 Families in 3 YEARS… What’s GOING ON at This House?
10.2K14 -
 33:21
33:21
David Diga Hernandez
1 day ago $0.89 earnedWhat No One Is Telling You About the End Times
22.6K4