Premium Only Content

Infographic Design!
Let's dive deeper into Infographic Design!
What is Infographic Design?
Infographic design is the art of visually representing information or data in a simple and engaging way. It's about taking complex concepts and breaking them down into easy-to-understand graphics. Think of it as storytelling through visuals.
Why Use Infographics?
Clarity and Conciseness: Infographics present information in a way that is easy to grasp, even for complex topics.
Engagement: Visuals are more engaging than plain text, capturing attention and making information more memorable.
Shareability: Infographics are highly shareable on social media, increasing their reach and impact.
SEO: Search engines love visual content, and infographics can help improve a website's search ranking.
Key Elements of a Great Infographic
Clear and Concise Title: The title should clearly state the main idea.
Engaging Visuals: Use a combination of icons, images, and charts to make the infographic visually appealing.
Limited Text: Keep the text concise and easy to read.
Consistent Design: Maintain a consistent color palette, typography, and layout throughout the infographic.
Call to Action: Encourage viewers to take a specific action, such as visiting a website or sharing the infographic.
Types of Infographics
Statistical: Present data using charts, graphs, and numbers.
Process: Illustrate a sequence of steps or a workflow.
Hierarchical: Organize information in a hierarchical structure.
Geographic: Visualize data related to a specific location.
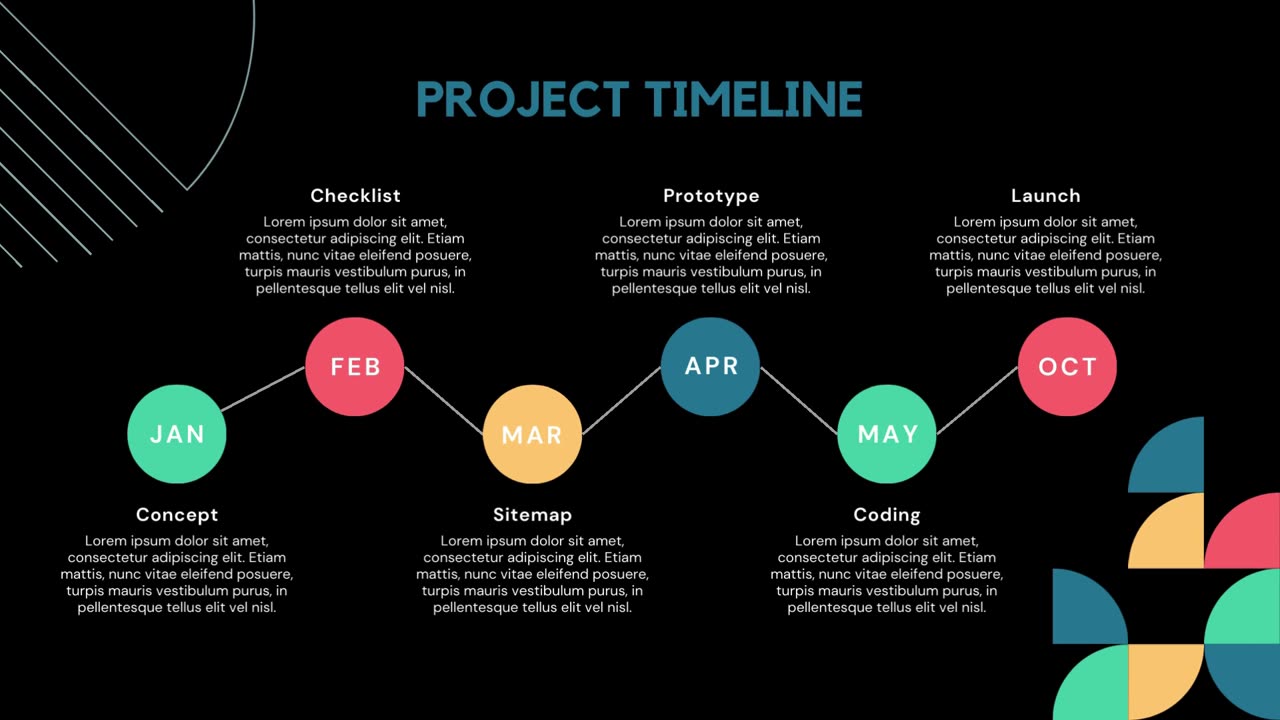
Timeline: Present information chronologically.
Tools for Creating Infographics
Canva: A user-friendly platform with a vast library of templates and elements.
Piktochart: Offers a variety of customizable templates and data visualization tools.
Venngage: Provides a wide range of infographic types and customization options.
Adobe Illustrator: A professional-grade vector graphics editor for creating highly customized infographics.
Tips for Effective Infographic Design
Know your audience: Tailor the infographic to the specific interests and knowledge level of your target audience.
Choose the right format: Select the format that best suits your data and message.
Prioritize clarity: Avoid clutter and focus on the most important information.
Tell a story: Create a narrative that guides the viewer through the infographic.
Test and iterate: Get feedback from others and make adjustments as needed.
Would you like me to help you create an infographic? I can assist you with:
Brainstorming ideas
Choosing the right tools
Designing your infographic
Providing feedback on your design
-
 46:34
46:34
Randi Hipper
1 hour agoWALL STREET'S CRYPTO BET REVEALED! HINT: IT'S NOT BITCOIN!
2.18K1 -
 LIVE
LIVE
The Mike Schwartz Show
1 hour agoTHE MIKE SCHWARTZ SHOW with DR. MICHAEL J SCHWARTZ 08-28-2025
4,169 watching -
 LIVE
LIVE
LFA TV
3 hours agoLFA TV ALL DAY STREAM - THURSDAY 8/28/25
4,810 watching -
 2:04:35
Game On!
20 hours ago $3.07 earnedCollege Football Is BACK! Week 1 Preview!
36.2K2 -
 4:00:18
The Bubba Army
1 day agoMinneapolis Shooter Story Unfolds! - Bubba the Love Sponge® Show | 8/28/25
74.5K9 -
 LIVE
LIVE
JuicyJohns
2 hours ago $0.26 earned🟢#1 REBIRTH PLAYER 10.2+ KD🟢
22 watching -
 LIVE
LIVE
GritsGG
2 hours agoWin Streaking! Most Wins 3485+ 🧠
96 watching -
 16:58
16:58
marcushouse
15 hours ago $4.39 earnedSpaceX Starship Flight 10: What Really Happened! 🚀
55.1K13 -
 3:47
3:47
Blackstone Griddles
15 hours agoCampground Meal Planning on the Blackstone Camping Griddle
31.5K2 -
 28:13
28:13
Her Patriot Voice
15 hours ago $2.35 earnedIs Flag Burning Free Speech?
35K24