11 months agoMicrosoft Excel: How to Improve your Charts & Tables for Better Communication - PromoLeila Gharani
11 months agoExcel Arrow Variance Chart: Dynamic Arrows in Chart to Show Change to Previous Year / BudgetLeila Gharani
11 months agoExcel Charts: Matrix or Excel Panel Charts - Showing many variables at onceLeila Gharani
6 months agoMicrosoft Excel Tutorial for Beginners | Excel Training | FREE Online Excel courseCreative World
7 months agoQuick And Easy Tips For Understanding Ribbon Navigation And The Quick Start MenuPharos Technology
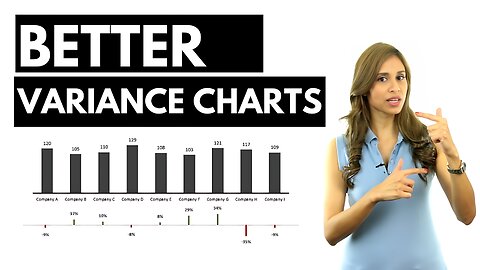
11 months agoBetter Excel Variance Charts to show percentage change (Simple & uncommon technique)Leila Gharani
1 month agoInstant solution to Grey Background on Pasted Data from CHAT GPT. on EXCEL WORD and POWERPOINTGorgeousExcel
11 months agoExcel 2016 Waterfall Chart - Advantages and Limitations - Ultimate guide to Excel's Bridge GraphLeila Gharani