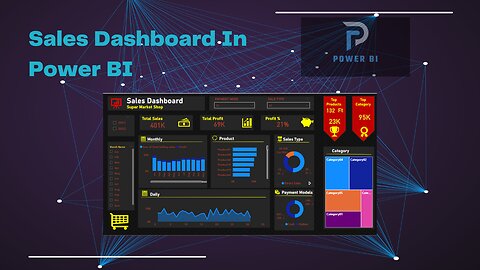
11 months agoSales Dashboard in Power BI | Power Bi | Excel | Power Point | Tutorial | Hindi/Urdu | (Part II)Space & Satellite Technology
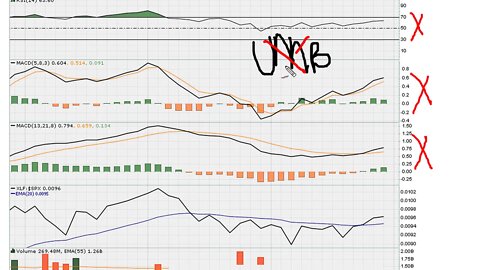
9 months agoThe BEST Indicator On TradingView: Squeeze Momentum Indicator Scalping StrategyDaviddTech Trading Strategies
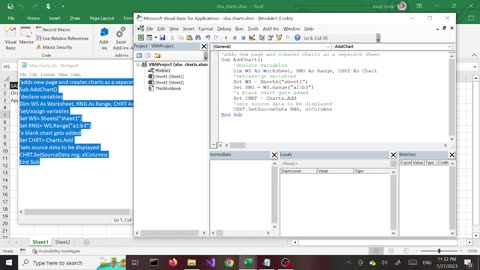
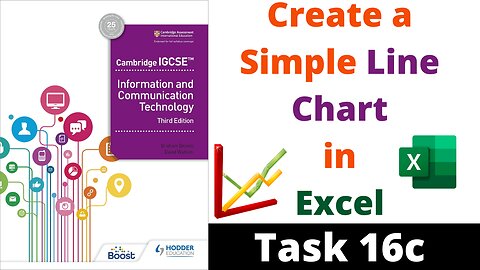
1 year agoTask 16c IGCSE ICT Charts - Create a Simple Line or Area Chart in Excel Hodder EducationIkyjudy
1 year agoLine Chart di dalam Cell - Google Sheets Tips & Tricks 9 #belajaronline #googlesheets #excelDEB Solution
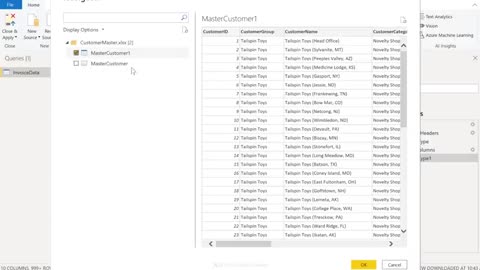
10 months agoPower BI Tutorial For Beginners | Create Your First Dashboard Now (Practice Files included)mohdsafyan
1 year agoOptimized Excel Line Charts: Prevent drop to zero & dynamic Legend positioningLeila Gharani
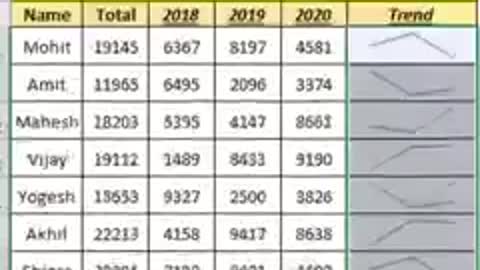
1 year agoHighlight Max & Min Values in an Excel Line Chart (Conditional Formatting in Charts)Leila Gharani
1 year agoExcel Arrow Variance Chart: Dynamic Arrows in Chart to Show Change to Previous Year / BudgetLeila Gharani