
Excel " Trend " Function | Forecast | Equations #exceltutorial #exceltips
2 years ago
10
Excel " Trend " Function
"TREND" typically refers to a trendline, which is a line superimposed on a chart that is used to depict the overall direction of the data. A trendline can be used in various types of charts, such as line charts, scatter charts, and bar charts, to show the trend in data over a period of time. In Microsoft Excel, trendlines are created using chart tools and can be customized to display the trend in different ways, such as linear, polynomial, logarithmic, exponential, and moving averages. The trendline helps to identify patterns and make predictions based on past data, making it a useful tool for data analysis and forecasting.
#excel #exceltutorial #exceltips #exceltricks #excelformula #excelshort #excelsupport
Loading comments...
-
 2:49:50
Barry Cunningham
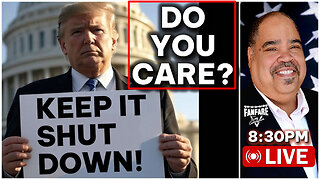
3 hours agoPRESIDENT TRUMP SPEAKS TO THE PRESS...NO DEALS! DO YOU CARE IF THE GOVERNMENT STAYS SHUT DOWN?
26.6K15 -

Tundra Tactical
1 hour ago🚨🚨Emergency Gun News!!!!🚨🚨 Did Glock Just Cave To Liberal Pressure?? Current Glocks Done?
8.26K1 -
 1:02:57
Sarah Westall
5 hours agoStructure of the World has Changed and Getting Back to Basics w/ Stacy Washington
24.8K5 -
 6:34
6:34
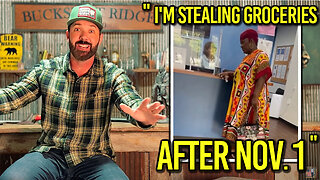
Buddy Brown
7 hours ago $0.03 earnedWatch What Happens When WELFARE QUEENS Get Denied FOOD STAMPS! | Buddy Brown
13.2K12 -
 LIVE
LIVE
Drew Hernandez
14 hours agoCHARLIE KIRK TRIAL JUDGE ISSUES GAG ORDER & U.S. MARSHAL ILLEGAL ALIEN SHOOTOUT?
953 watching -
 LIVE
LIVE
DLDAfterDark
2 hours agoIs Glock Anti 2A?? Glocks Terrible Recent Decisions & More
144 watching -
 1:58:02
tminnzy
3 hours agoLAST REMAINING BLACK OPS 6 PLAYER 🦁
11.6K -
 LIVE
LIVE
Side Scrollers Podcast
2 days ago🔴SIDE SCROLLERS FUND-A-THON🔴DAY 2🔴100% REVENUE HELPS CHANGE CULTURE!
972 watching -
 1:47:13
Flyover Conservatives
22 hours agoURGENT UPDATE: Why Halloween Matters This Year— October 24-31 w/ Bo Polny | FOC Show
20.2K -
 LIVE
LIVE
This is the Ray Gaming
2 hours ago $0.10 earnedI'm All Out Of Tacos | Rumble Premium Creator
16 watching