11 months agoBuild Impressive Charts: It's NOT your usual Bar Chart (Infographics in Excel)Leila Gharani
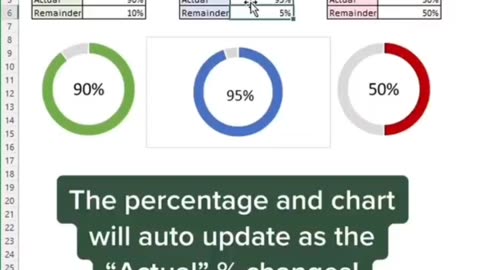
1 year agoHow to make a completion chart in under 60 secondsLevel up in Excel #ytshorts #excelKNOWLEDGEWITHALEX
11 months agoDynamic WordArt in Excel with Bar in Bar Chart (Info-chart that shows % completion)Leila Gharani
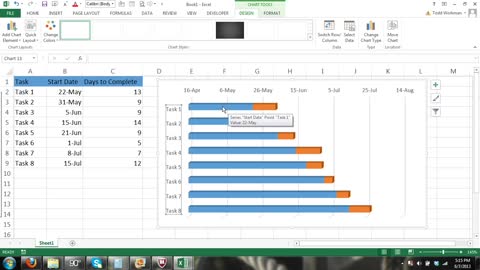
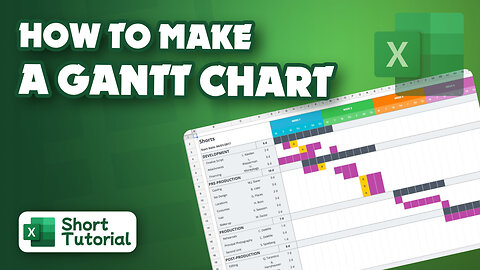
3 years agoMicrosoft Excel Gantt Chart Tutorial - How to Create a Gantt Chart w/Excel 2013 Bar ChartSubjectmoney.com
11 months agoExcel Conditional Bar Chart with Drop-down & Icons (This Chick's Trouble for Excel Hash)Leila Gharani
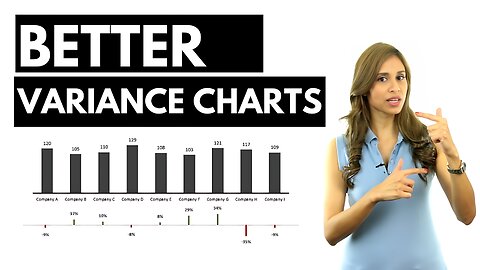
11 months agoBetter Excel Variance Charts to show percentage change (Simple & uncommon technique)Leila Gharani
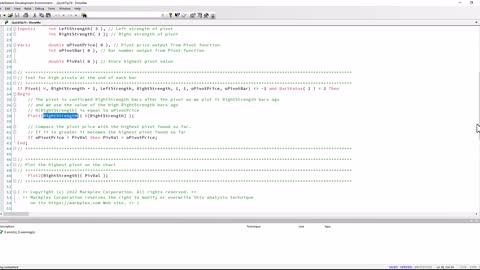
1 year agoQuickTip 74 | Finding the highest pivot on a chart | TradeStation EasyLanguage tutorialsMarkplex
11 months agoExcel Arrow Variance Chart: Dynamic Arrows in Chart to Show Change to Previous Year / BudgetLeila Gharani
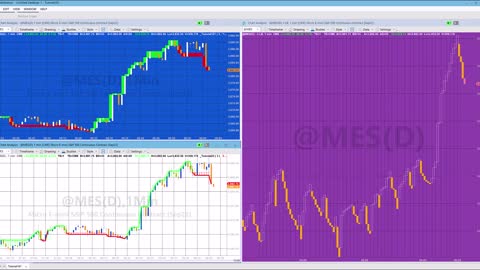
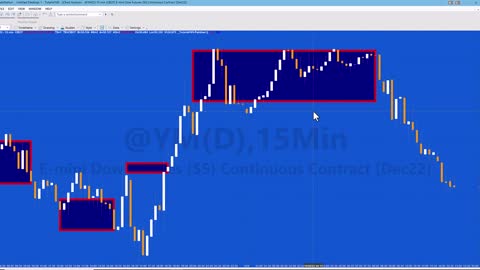
1 year agoThe Footprint - Completed Auctions and Unfinished Business - Session VII - The Pit Futures TradingThePit
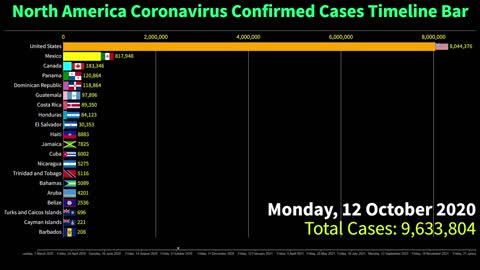
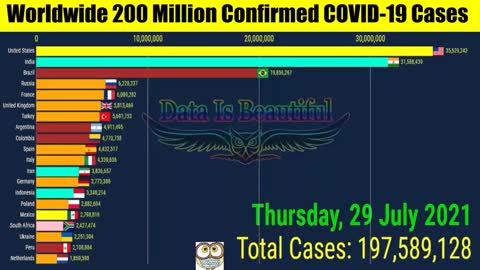
2 years agoTop 20 American Countries by Total COVID-19 Cases Timeline Bar | 31st January 2022 Coronavirus Graphfunny and comedy
1 year agoTutorial 181 | Three Line Break on minute chart using a vector object | TradeStation tutorialsMarkplex
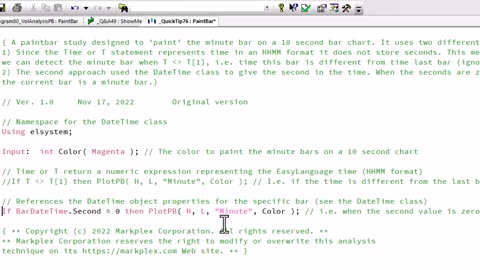
1 year agoQuickTip 76 | Painting the minute bar on a 10 second bar chart | TradeStation EasyLanguageMarkplex
1 year agoEasyLanguage Tutorial 185 | Changing the TradeStation DataTip when hovering over drawing objectsMarkplex
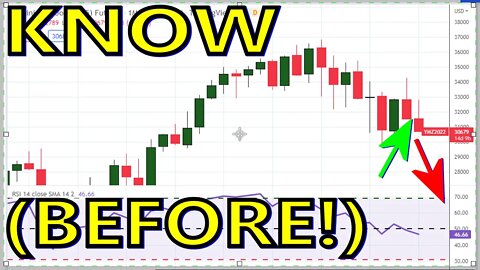
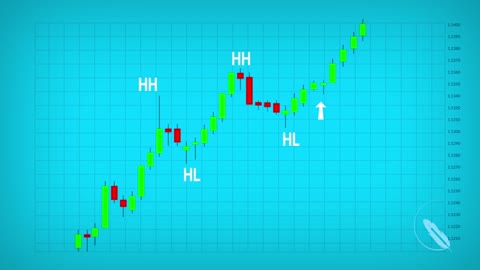
1 year ago🔴 How Traders Can Take Advantage Of Big Swings In Technical Analysis (Secret Hack) #Crypto #StocksMuathe.com
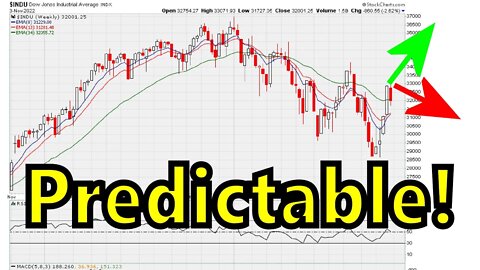
1 year ago🔴 How To Use Numbers To Predict Market Direction of Any Trading Market (Cryptos, Stocks, Forex, etc)Muathe.com


![[ Mentorship ] Understanding RSI 50: Crossing + Uniform Support/Rejection](https://hugh.cdn.rumble.cloud/s/s8/1/i/j/B/Q/ijBQd.oq1b.2-small--Mentorship-Understanding-R.jpg)