Premium Only Content
![[ Mentorship ] Understanding RSI 50: Crossing + Uniform Support/Rejection](https://1a-1791.com/video/s8/1/i/j/B/Q/ijBQd.qR4e-small--Mentorship-Understanding-R.jpg)
[ Mentorship ] Understanding RSI 50: Crossing + Uniform Support/Rejection
LIKE | COMMENT | SHARE | SUBSCRIBE
My Website; http://www.muathe.com/
Original Muathe.com Concepts!
We take a look at RSI 50 crossing, long-term trend indication when the RSI is above or below 50, and also RSI 50 uniform activity support and rejection in determining the odds of improved new highs after a pullback or fresh lows after a recovery bounce back move.
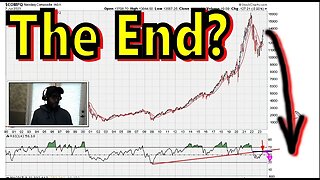
We look at individual stock charts and also look at some world market indices going as far back as the 1980's in one chart example with impressive conclusions that what we are studying here has been back-tested thoroughly and is worth our contemplation, consideration and implementation.
RSI formula
100
RSI = 100 - --------
1 + RS
RS = Average Gain / Average Loss
In this Relative Strength Index - RSI - lesson we look at how the mathematics of the RSI 'force'
instruments to stage huge price swings as they move above or below the RSI 50 level. This is observed in all chart time frames (minute, hourly, daily, weekly and monthly) and in any and all trading instruments worldwide.
What you will learn in this video is quite frankly not known by many traders (both amateur and professional) and it will help explain why markets or individual stocks suddenly stage huge moves.
Here is the RSI formula;
RSI = 100 - [100 / (1+RS*)]
* RS = Average Gain / Average Loss
Because the RSI is essentially a measure of AVERAGE GAIN versus AVERAGE LOSS over the most recent period of time (usually 14 periods or bars - which translates to say the most recent 14 minutes, or the most recent 14 hours, or the most recent 14 days, or the most recent 14 weeks, or the most recent 14 months) it is a mathematical fact that if a stock is trading below 50 then the only way it can move the RSI above 50 is by introducing a large positive number into the mix. It is also a mathematical fact that if a stocks is trading above 50 then the only way it can move the RSI below 50 is by introducing a large negative number into the mix.
The only way to move the RSI above 50 is by introducing a large gain into the mix (so that the average gain can outweigh the average loss).
The only way to move the RSI below 50 is by introducing a large loss into the mix (so the average gain can outweigh the average loss).
Understanding this can help traders make informed decisions because for example one should not be surprised to see big market or stock swings when instruments are trading near the 50 RSI level - especially on daily or weekly time frames.
The Relative Strength Index was developed by J. Welles Wilder and he is the one who recommended the use of the 14 bar setting - which is way it is the default in most chart settings even though you can use any bar setting. Personally for hourly chart settings I prefer to use a 26 bar setting because it gives a smooth RSI reading and gets rid of excessive hour to hour volatility.
I also have to add that even though Wilder recommended the use of the 14 bar setting I believe that 13 is actually the correct setting because 14 is not a strong number in numerology as compared to 13 [ for example we have 7 days and 6 nights of creation which adds up to 13, the number 13 represents femininity because it corresponds to the number of lunar (menstrual) cycles in a year (13 x 28 = 364 days) and also humans undergo a massive chemical, physiological and consciousness change near the age of 13 ].
For more take a look at the following playlists:
RSI 50 Crossing
https://www.youtube.com/playlist?list=PLjHhEQ5LDpkYNkVual4lILwNXBErtiidg
RSI 50 Uniform Rejection + Support
https://www.youtube.com/playlist?list=PLjHhEQ5LDpkZy6WqgZkBGhDt-LzoRDvYT
Scotts Miracle-Gro Co
NYSE: SMG
$SMG
India Glycols Ltd.
NSE: INDIAGLYCO
$INDIAGLYCO $INDIAGLYCO.IN
S&P 500 Index
SPX
$SPX
$SPY
$ES_F
NIFTY 50
NSE: NIFTY
$NIFTY
Nikkei 225
INDEXNIKKEI: NI225
$NIKK
Hang Seng Index
INDEXHANGSENG: HSI
$HSI
Índice Bovespa
INDEXBVMF: IBOV
$BVSP
The SSE Composite Index
$SSEC
TAGS
financial charts
finance stocks
trending stocks
books on technical analysis
short term trading
forex trading signals
stock market graphs
chart software
forex trading software
trading platform
free stock analysis
stock analysis on net
how to research stocks
intraday technical analysis
technical analysis from a to z
momentum technical analysis
technical analysis basics
currency trading for dummies
swing trading strategies
technical analysis macd
-
 19:54
19:54
Muathe.com
2 years ago $0.02 earned🟢 MAJOR Bear Market Has Began!? Stocks, Crypto
98 -
 25:07
25:07
Texas Quality Assurance | TQA Cloud QMS | #QualityMatters
3 years agoEp 27 - Support Processes _ Understanding the Standard
57 -
 4:39
4:39
Muathe.com
3 years agoDouble Top RSI 69.1 Uniform Rejection - #1456
18 -
 1:03
1:03
nrlince
3 years ago $0.03 earnedElk crossing
41 -
 3:35:50
FomoTV
8 hours ago🚨 Swamp Theater: FBI Raids Bolton 🕵 Still NO Epstein Files, Trump's Troops & the Red Heifer Hoax 🐂 | Fomocast 08.23.25
17.7K3 -
 6:04:40
Akademiks
11 hours agoRoc Nation & Meg Thee Stallion did a 7 HOUR Deposition with me. Drake Secret Kid Finally Revealed.
55.2K2 -
 24:19
24:19
Stephen Gardner
8 hours ago🚨BREAKING: FBI Raid of John Bolton’s House Reveals THIS!
57.3K136 -
 8:31
8:31
MattMorseTV
10 hours ago $1.17 earnedTexas just did the IMPOSSIBLE.
49.4K63 -
 24:39
24:39
MYLUNCHBREAK CHANNEL PAGE
1 day agoInterdimensional Beings at Borobudur
57.3K32 -
 12:42
12:42
Scammer Payback
1 day agoCalling Scammers who were Raided
27.3K11