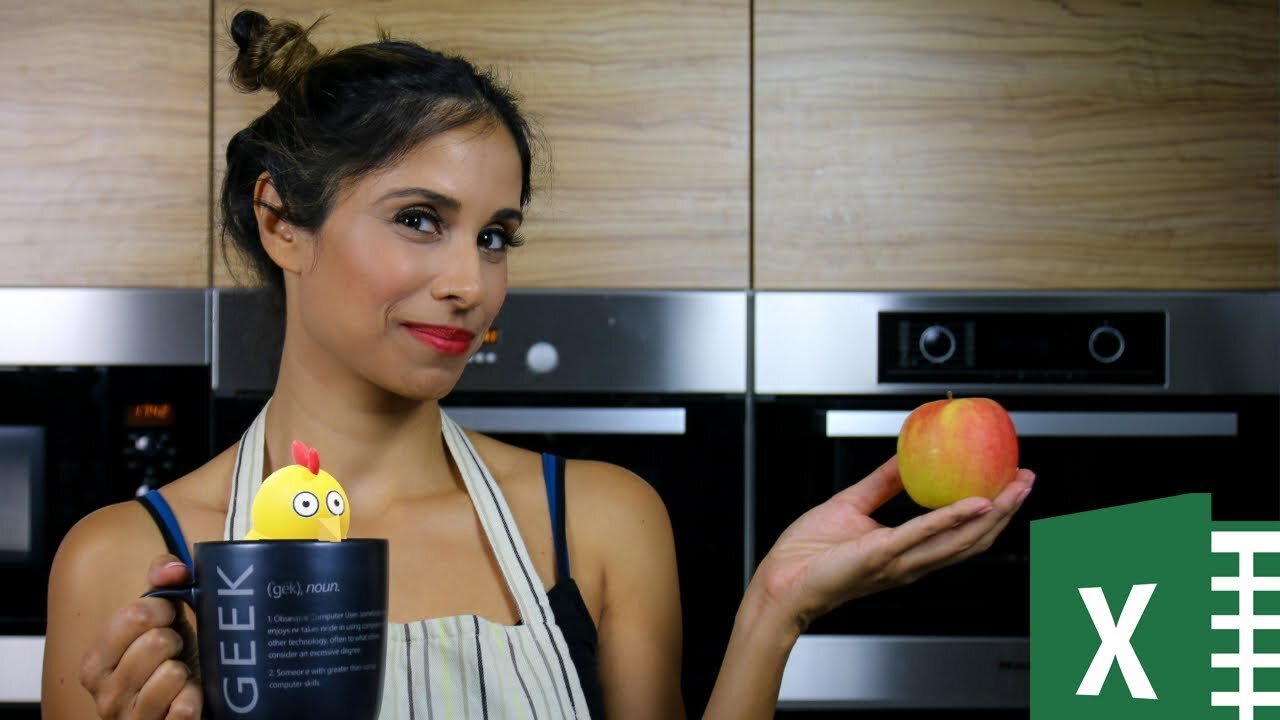
Excel Conditional Bar Chart with Drop-down & Icons (This Chick's Trouble for Excel Hash)
Sep 4, 2018 Excel Dashboards & Reports
How can you combine unrelated Excel features to create a visualization your boss will be proud of? That's what I try to do using Excel's FREQUENCY function, Form Controls, MAX formula & 3D models.
My solution is an Excel dynamic bar chart with icons. It's not your standard bar chart. It's an Excel chart that's conditionally formatted:
The highest value is conditionally formatted with an icon. The icons are automatically hidden for the remaining bars. We use a trick to get it conditionally formatted. There are a lot of Excel chart tricks used here if you pay close attention. I'll also show you how you can use 3Dmodels in PowerPoint at the end of the video.
This is solution entry to Oz du Soleil's #ExcelHash competition.
VOTE for your favorite here: https://tinyurl.com/y9hmvelp (voting is closed)
The entire Playlist is here: https://www.youtube.com/playlist?list=PLHrPHBbDHgT0UnY1qb36YZrBwpWNJX8Lx
Other ExcelMVPs in the Excel Hash challenge are:
Mike Girvin - Excel Is Fun
Bill Jellen - MrExcel
Mynda Treacy - MyOnlineTrainingHub
Jon Acampor - Excel Campus
Oz du Soleil - Excel on Fire
★ Links to related videos: ★
Learn Index Match: https://youtu.be/F264FpBDX28
Charts basics: https://youtu.be/DAU0qqh_I-A
★★ My Online Excel Courses ★★
Courses ► https://courses.xelplus.com/
🕮 Excel Resources I Recommend 🕮
https://www.xelplus.com/resources/
✉ Subscribe & get my Excel top 10 tips and formulas e-book for free
https://www.xelplus.com/free-ebook/
Music: Italian Afternoon by Twin Musicom is licensed under a Creative Commons Attribution license (https://creativecommons.org/licenses/by/4.0/)
Artist: http://www.twinmusicom.org/
#ExcelHash #MsExcel #LeilaGharani
-
 LIVE
LIVE
DLDAfterDark
2 hours agoJust Another Tuesday - In Virginia - The Governor's Race & Glock Talk
98 watching -
 3:21:38
The Charlie Kirk Show
5 hours agoJUDGMENT DAY 2025: The Election Results Stream
161K72 -
 3:51:07
MattMorseTV
6 hours ago $0.69 earned🔴Election Day LIVE COVERAGE.🔴
78.3K43 -
 1:16:51
Flyover Conservatives
22 hours agoSHOCKING DATA REVEALS: Young Voters Are Done With the Old GOP - Mark Mitchell, Rasmussen Reports | FOC Show
26.6K15 -
 1:15:28
Sarah Westall
5 hours agoGrooming is Protected and Encouraged by the System – Michelle Peterson and Mike Adamovich
25.4K6 -
 LIVE
LIVE
Akademiks
3 hours agoKendrick tries to Flip the Bots on DRAKE? WHo Beats Jay z in a verzuz. Blueface finally free!
965 watching -
 1:38:16
Professor Nez
8 hours ago🚨ELECTION NIGHT 2025 LIVE! Massive Upsets Brewing in New York, New Jersey & Virginia!
28.1K9 -
 LIVE
LIVE
Due Dissidence
11 hours agoLIVE: ELECTION RESULTS From NYC, NJ, and VA - Trump Approval CRATERS, Kash's Private Jet CRASH OUT
885 watching -
 12:50
12:50
Demons Row
4 hours ago $0.03 earnedBikers of New Jersey 💀🏍️ Pagans, Thunder Guards, and Thug Riders
23.2K6 -
 42:31
42:31
Stephen Gardner
7 hours ago🔥Old Obama Video RESURFACES - His Own Words CONDEMNED Him! Trump Gains MASSIVE Momentum!!
30.5K22