1 year agoExcel Arrow Variance Chart: Dynamic Arrows in Chart to Show Change to Previous Year / BudgetLeila Gharani
2 years agoGareth Soloway: Gold Will Outperform Bitcoin and Stocks this YearPalisades Gold RadioVerified
10 months agoChatGPT 4 - Create Beautiful Graphs And Charts In Seconds - NO EXCEL REQUIRED - Daigr.amAI Solutions
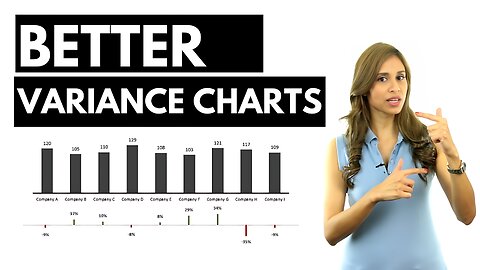
1 year agoBetter Excel Variance Charts to show percentage change (Simple & uncommon technique)Leila Gharani
7 months agoMicrosoft Excel Tutorial for Beginners | Excel Training | FREE Online Excel courseCreative World
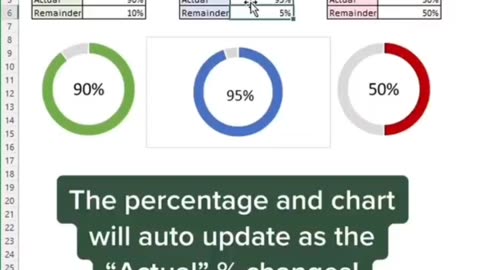
1 year agoHow to make a completion chart in under 60 secondsLevel up in Excel #ytshorts #excelKNOWLEDGEWITHALEX