Tutorial 197 | Storing bar and analysis technique data in Excel
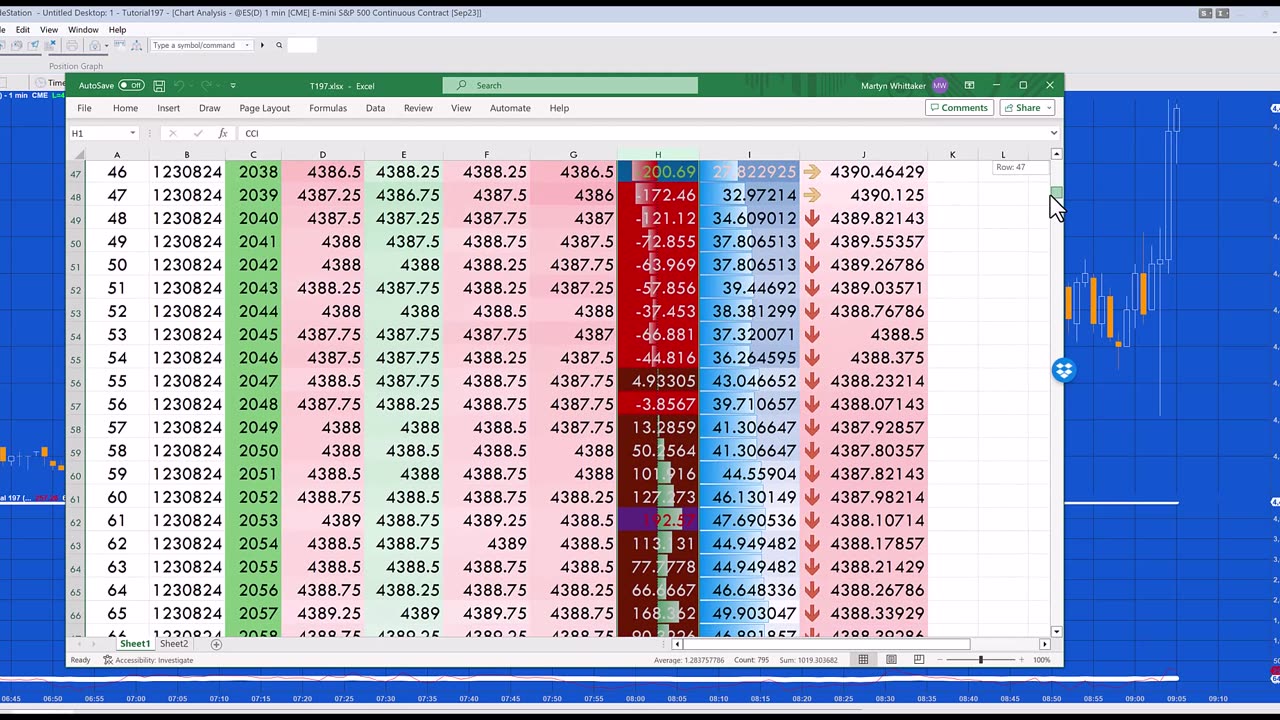
A Gold Pass member asked how to create an Excel spreadsheet with n rows and m columns, the n rows representing each of the successive bars on an intraday chart, and for each of the n rows a column for each of the m different indicator values that appear on that bar. In tutorial 197 the following data is stored for each successive bar: a bar counter, date , time, close, open, high, low, the value of the calculated CCI, the values of the calculated RSI and the average of the closing price. The values for the most recent bar are updated in real time.
When the program is restarted it reopens and rewrites the data.
The tutorial also touched upon the use of the Microsoft Excel "Conditional Formatting" feature.
Other Excel integration tutorials include:
Tutorial 150 | Sharing data between two charts using Microsoft Excel
Tutorial 113 | Using data from an Excel sheet to update an EasyLanguage program
Tutorial 112 | Transfer price data from a Price Series Provider applied to a chart to an Excel spreadsheet
Tutorial 96 | Using the Workbook component to share information with Excel
-
 LIVE
LIVE
Wendy Bell Radio
4 hours agoPet Talk With The Pet Doc
920 watching -
 30:58
30:58
SouthernbelleReacts
2 days agoWe Didn’t Expect That Ending… ‘Welcome to Derry’ S1 E1 Reaction
2.51K -
 13:51
13:51
True Crime | Unsolved Cases | Mysterious Stories
4 days ago $0.15 earned7 Real Life Heroes Caught on Camera (Remastered Audio)
5K -
 LIVE
LIVE
Total Horse Channel
10 hours ago2025 IRCHA Derby & Horse Show - November 1st
33 watching -
 4:19
4:19
PistonPop-TV
6 days agoThe 4E-FTE: Toyota’s Smallest Turbo Monster
3.08K -
 43:07
43:07
WanderingWithWine
5 days ago $0.04 earned5 Dreamy Italian Houses You Can Own Now! Homes for Sale in Italy
3.68K2 -
 LIVE
LIVE
Spartan
19 hours agoFirst playthrough of First Berserker Khazan
283 watching -
 28:01
28:01
Living Your Wellness Life
2 days agoTrain Your Hormones
6.54K -
 43:28
43:28
The Heidi St. John Podcast
1 day agoFan Mail Friday: Faith Over Fear and Finding Strength in Every Season
3.46K -
 1:05:30
SGT Report
1 day agoTHE HORRIBLE TRUTH ABOUT EVERYTHING -- Harley Schlanger
45.2K86