17 days agoCreate the Stunning Horizon Graph Using Python | Data VisualizationAI Evolutionary Technology
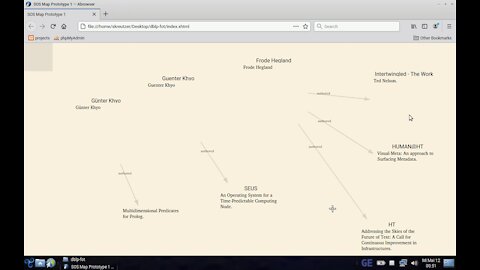
1 year agoThe 2nd Dimension explained: Flatland and the Quantum Dimensions. #flatland #criticalthinkingSound Off
7 months agoNASA video "Weekly Arctic Sea Ice Age with Graph of Ice Age By Area: 1984 - 2019"NASA CommonsVerified
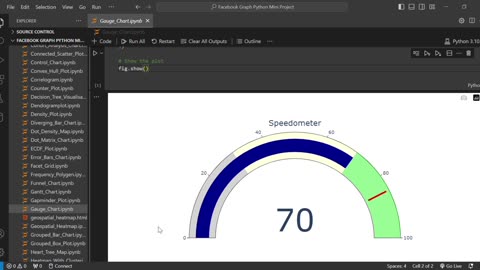
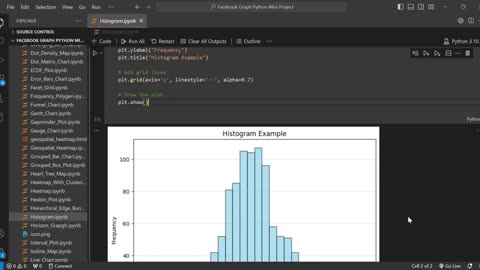
17 days agoCreate Beautiful Histogram Plot in Python 📊 | Data Visualization Tutorial 🎨🐍AI Evolutionary Technology