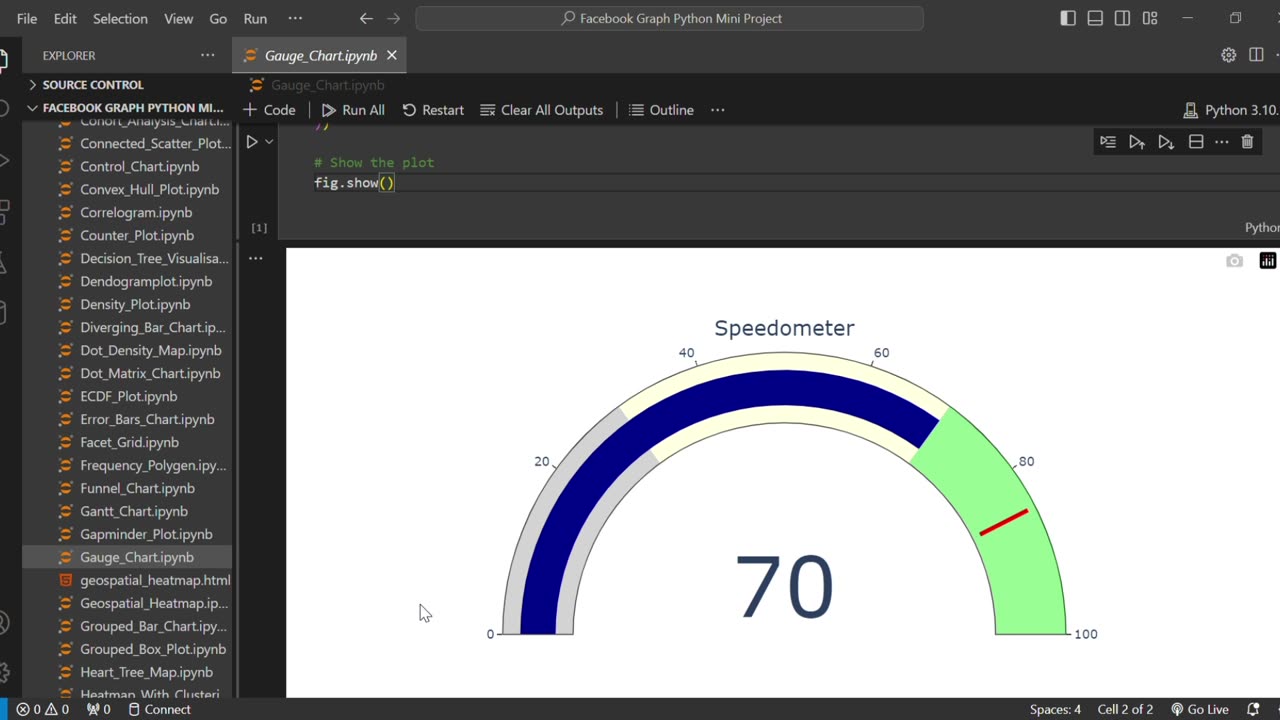
Create a Speedometer Gauge Chart in Python Using Plotly 📊🐍
#Python #Plotly #DataVisualization
Want to visualize your data in a more interactive and engaging way? In this video, you'll learn how to create a Speedometer-style Gauge Chart using Plotly in Python – step-by-step!
We’ll cover: ✅ Creating a gauge chart using plotly.graph_objects
✅ Customizing color zones (gray, yellow, green)
✅ Adding threshold indicators
✅ Making your charts look clean and professional
This tutorial is perfect for beginners and data visualization enthusiasts looking to build modern dashboards and indicators in Python.
🔔 Don’t forget to Like, Comment, and Subscribe for more Python & Data Visualization tutorials!
#Python #Plotly #DataVisualization #Dashboard #GaugeChart #PythonTutorial #Python #Plotly #DataVisualization #GaugeChart
#SpeedometerChart #PythonDashboard #PythonPlotly #PlotlyTutorial
#PythonBeginner #PlotlyIndicator #PythonDataScience #PythonVisualization #CreateGaugeChart #PythonGraph
#DashboardInPython
-
 0:20
0:20
AI Evolutionary Technology
1 month agoUsing Python to Analyze Your Internet Connection
171 -
 18:08
18:08
Professor Nez
4 hours ago🚨HOLY CRAP: Members of Congress Call for Military INSURRECTION!
96.5K71 -
 4:14:26
Grant Cardone
6 hours agoHow to Buy Real Estate With NO Money Down (LIVE Training With Grant Cardone)
95.1K5 -
 1:56:11
AlaskanBallistics
13 hours ago $1.66 earnedShooting the WhisperStrike WT30 Live!
14.2K -
 19:53
19:53
MetatronHistory
20 hours agoRome VS Greece - Ultimate Clash of Civilizations Explained
49.6K13 -
 LIVE
LIVE
The Big Mig™
6 hours agoThe Big Mig Show's Greatest Hits w/ Americas Future, Karmageddon, Operation Gideon,..
186 watching -
 1:32:33
VapinGamers
5 hours ago $5.95 earnedTools of the Trade - EP12 The Art of Story Telling with MidnightinTheMountains - !rumbot !music
34.9K2 -
 3:09:50
SOLTEKGG
5 hours ago🔴LIVE - Battlefield 6 - Going Pro in RED SEC
33.5K1 -
 5:19:03
Midnight In The Mountains™
6 hours agoThe Midnights Play Arc Raiders | Loot Scoot and KILL | Crypto Wallet up n running GO JOIN THE BETA!
26.1K4 -
 53:25
53:25
X22 Report
8 hours agoMr & Mrs X - Trump Is Using The Same Tactic As Our Founding Fathers To Rebuild America - EP 17
102K37