


America’s verdict on most disputed doggy debate
Three in four dog parents think their canine is the “main character” of their family (76%), according to new research.
A survey of 2,000 dog parents found that pups are so highly regarded, that a majority think of their dog as their child (84%).
Because of this, twice the number of respondents think of their dog before anyone else after a stressful day — even more than their partner (41% vs. 19%).
The survey also looked at the common “pet commandments” in the average household, settling some of the common doggy debates.
Conducted by Talker Research for The Pets Table, a pet food brand by HelloFresh, results showed that fur parents said it’s perfectly acceptable for dogs to be on the couch (70%) and on the bed (67%).
On the other hand, a vast majority have strong feelings against dogs at the dinner table (70%) — yet, the average dog parent feeds their dog table scraps four times a week, with one in six doing so every day.
And although most see their pets as their kids, more than half of those surveyed (56%) frowned upon the idea of using strollers for their dogs.
How do Americans feel about puppy love? The jury has spoken: most respondents said their dog is allowed to lick their face (56%), while 44% said they aren’t.
No matter what, canines come first in respondents’ households, with nearly half saying they’d rather cut some of their own expenses than those of their dogs (48% vs. 9%), particularly when it comes to going out (70%), shopping (60%) or traveling (53%).
On average, dog parents splurge on $612.10 worth of things for their dog every year; one in seven would even cross the $1,000 line on presents for their pet within a year.
The top ways respondents enjoy spoiling their dog is with premium food and treats (62%), birthday presents (40%) and clothes (21%).
Looking at whether or not pet parents have routines for feeding time or going outside, results showed that just 18% have a “strict schedule,” while 42% consider themselves as someone who goes with the flow.
Respondents are most likely to stick to a strict schedule when it comes to giving their dogs meals (62%); otherwise, they go by whenever it feels right to give them treats (65%), allow them to take a nap (83%) or go outside (62%).
Similarly, just three in 10 said their dog has an official bedtime (31%), at about 9:30 p.m. on average.
Even if they don’t have a set schedule, respondents mentioned that their dog is used to certain activities every day, like being able to go outside (73%) — specifically at about 1:36 p.m.
Dogs are also in the daily habit of having treats (65%), playtime (53%) and walks (51%).
Thirty-five percent said their dog also expects to eat a specific food every day.
"We believe that pets are part of the family and deserve to live life to the fullest,” said Dovas Zakas, co-founder and chief marketing officer of The Pets Table. “While pet parenting styles may differ between families, finding that a majority of households think of their pets as children reinforces our core values of health, quality and happiness for our pups.”
For many, it’s their dog’s way or the highway, as 40% said their pup is likely to be moody if they don’t get to do what they expect.
Punctuality is important since fur parents said that their dog would remind them to go outside (57%), eat dinner (43%) and have treats (35%) if they were behind.
While most believe they’re already doing their duty by feeding their dog a healthy diet (83%) — with the most popular pet food options being kibble (45%) or a mixed diet (29%) — one in seven notice that their dog has gained weight within the past six months.
To try something new, a quarter of respondents would be likely to shift their pup’s food to a human-grade option — especially since a majority said it’s important that their dog has the same quality of food as them (77%).
“Providing our fur babies with a wholesome, minimally-processed diet is one of the most important ways of protecting their health,” said Zakas. “Choosing healthy food for your dog is essential for their well-being. By prioritizing their diet, we not only enhance their health but also show our commitment to their happiness and longevity. After all, our pets deserve nothing but the best!"
Survey methodology:
Talker Research surveyed 2,000 dog owners; the survey was commissioned by The Pets Table and administered and conducted online by Talker Research between July 5 and July 9, 2024.
We are sourcing from a non-probability frame and the two main sources we use are:
Traditional online access panels — where respondents opt-in to take part in online market research for an incentive
Programmatic — where respondents are online and are given the option to take part in a survey to receive a virtual incentive usually related to the online activity they are engaging in
Those who did not fit the specified sample were terminated from the survey. As the survey is fielded, dynamic online sampling is used, adjusting targeting to achieve the quotas specified as part of the sampling plan.
Regardless of which sources a respondent came from, they were directed to an Online Survey, where the survey was conducted in English; a link to the questionnaire can be shared upon request. Respondents were awarded points for completing the survey. These points have a small cash-equivalent monetary value.
Cells are only reported on for analysis if they have a minimum of 80 respondents, and statistical significance is calculated at the 95% level. Data is not weighted, but quotas and other parameters are put in place to reach the desired sample.
Interviews are excluded from the final analysis if they failed quality-checking measures. This includes:
Speeders: Respondents who complete the survey in a time that is quicker than one-third of the median length of interview are disqualified as speeders
Open ends: All verbatim responses (full open-ended questions as well as other please specify options) are checked for inappropriate or irrelevant text
Bots: Captcha is enabled on surveys, which allows the research team to identify and disqualify bots
Duplicates: Survey software has “deduping” based on digital fingerprinting, which ensures nobody is allowed to take the survey more than once
It is worth noting that this survey was only available to individuals with internet access, and the results may not be generalizable to those without internet access.
23
views
1
comment

How parents plan to make back-to-school ‘magical’ for their kids
More than four in five parents are working to make the back-to-school season “magical” for their elementary school kids, according to new research.
A survey of 2,000 parents with children aged 6-12 found 86% are trying to bring the “magic” back to school and, for many, their goal is getting their child excited about returning to the classroom.
In order to do so, parents allow their child to choose their clothing and outfits (62%), purchase school supplies that their child likes (62%) and help support their child’s passions and interests (56%).
Almost one in five parents (19%) even admit that they disliked school when they were their child’s age, and 96% are hoping to create more positive memories for their little ones.
Results found that only 40% of kids are typically “very excited” to return to school after summer break, which means parents are working overtime to make it more enjoyable.
Parents use hands-on learning (63%), food or snack activities (43%) or “magic” experiences (25%), such as fantasy activities or shows, in order to get their kids excited about learning.
Conducted by Talker Research on behalf of Keebler, to highlight their portfolio of snacks ahead of the back-to-school season, the survey looked into the different ways parents are finding the “magic” for their children.
Many parents are surprising their kids with their favorite snack (43%), slipping notes into their lunchbox (33%), and giving their child a “lucky charm” to help the school day go smoothly (19%).
In fact, 86% of parents are likely to pack a sweet snack for their child on any given school day — with Monday (52%) and Friday (57%) being the most frequent days.
Parents also believe that their child prefers sweet treats more than they do (36% vs 7%), though 56% admit they both share that love equally.
When it comes to their favorite sweet treats, cookies came out in the top three for kids and parents alike — cookies were No. 1 for kids (51%), and No. 2 for parents (41%). Also in the top choices for kids were chips (50%), while parents preferred ice cream (46%).
Chocolate ranked as the top favorite flavor for both kids and their parents (57% and 46%), followed by strawberry (39%) for kids and caramel (35%) for parents.
While parents use their child’s after-school snack as an excuse to have one themselves an average of two times per week, 27% admit they’re likely to do so every day.
In fact, 80% of parents are likely to enjoy the same after-school snack as their child, regardless of their preferences.
“The back-to-school season signifies a change for all members of a family,” said Alicia Mosley, Vice President of Marketing, Keebler Brand. “And during this transitional time, there’s plenty of small ways to make a new routine ‘magical’ and help instill that love of learning and school in your child. Whether you’re putting notes in your child’s lunch box or surprising them with their favorite snack, enjoying sweet treats both during and after school can keep the magic alive and make heading back to school exciting.”
According to the results, 70% of parents believe that an after-school snack is a ”magic” fix when their child has had a rough day.
On top of that, another 70% say that their child believes that magic is real.
Aside from snacks, parents work to keep that magic alive by encouraging their child to use their imagination (70%), help ensure they believe in the Easter Bunny, Tooth Fairy or Santa Claus (53%), teach them to always see the best in people and their experiences (50%) and encourage them to look for the unexpected (46%).
“It’s encouraging to see parents working so hard to keep magic alive for their children and it’s those little moments of magic that their children are going to remember and cherish for the rest of their lives,” said Mosley.
Survey methodology:
Talker Research surveyed 2,000 parents of kids ages 6-12; the survey was commissioned by Keebler and administered and conducted online by Talker Research between July 8 to July 16, 2024.
We are sourcing from a non-probability frame and the two main sources we use are:
● Traditional online access panels — where respondents opt-in to take part in online market research for an incentive
● Programmatic — where respondents are online and are given the option to take part in a survey to receive a virtual incentive usually related to the online activity they are engaging in
Those who did not fit the specified sample were terminated from the survey. As the survey is fielded, dynamic online sampling is used, adjusting targeting to achieve the quotas specified as part of the sampling plan.
Regardless of which sources a respondent came from, they were directed to an Online Survey, where the survey was conducted in English; a link to the questionnaire can be shared upon request. Respondents were awarded points for completing the survey. These points have a small cash-equivalent monetary value.
Cells are only reported on for analysis if they have a minimum of 80 respondents, and statistical significance is calculated at the 95% level. Data is not weighted, but quotas and other parameters are put in place to reach the desired sample.
Interviews are excluded from the final analysis if they failed quality-checking measures. This includes:
● Speeders: Respondents who complete the survey in a time that is quicker than one-third of the median length of interview are disqualified as speeders
● Open ends: All verbatim responses (full open-ended questions as well as other please specify options) are checked for inappropriate or irrelevant text
● Bots: Captcha is enabled on surveys, which allows the research team to identify and disqualify bots
● Duplicates: Survey software has “deduping” based on digital fingerprinting, which ensures nobody is allowed to take the survey more than once
It is worth noting that this survey was only available to individuals with internet access, and the results may not be generalizable to those without internet access.
13
views

Why 3 in 4 Gen Z blame social media for their mental health decline
Three in four Gen Zers are putting the blame on social media for having a negative impact on their mental health, according to a new study.
The poll of 2,000 Gen Z Americans who use social media found Instagram (20%), TikTok (20%) and Facebook (13%) have all had a negative impact on their wellbeing.
Many said the reasons they use social media are because they’re bored (66%), want to laugh (59%), want to see what’s happening in the world (49%) and to see what their friends are up to (44%).
However, this social media scrolling leaves nearly half of Gen Zers (49%) feeling some kind of negative emotion like stress and anxiety (30%).
Commissioned by LG Electronics and conducted by Talker Research, the study found those who experience negative emotions report that it only takes them 38 minutes on social media before they start to feel bad.
Respondents attribute these feelings to consuming upsetting content (51%), feeling unproductive with how they spent their time (49%) and/or experiencing FOMO (36%).
The average person spends five and a half hours on social media apps per day, and 45% believe they spend more time on social media than their friends.
“We spend a significant portion of our lives online and often these experiences may leave us feeling drained and not mentally stimulated,” said Louis Giagrande, head of U.S. marketing at LG Electronics. “We encourage everyone to be more conscious about the social media content they choose to engage with, bringing stronger balance, inspiration and happiness to their lives. If we focus on optimism, we will be better equipped to deal with life’s challenges and build a happier life.”
Results also found, not surprisingly, 62% of Gen Zers wish they could “reset” their social media feeds and start over again.
Over half (53%) report feeling frustrated that content on their feed doesn’t match what they want to see.
Just as many (54%) believe they have either “some,” “little,” or “no control at all” over what they see on their social media feeds. In fact, only 16% believe they have total control over what they see.
While many said they associate platforms with negative emotions, the study also found 80% claimed they also associate social media with a positive impact on their mood.
Content reported to evoke positive emotions are comedy (65%), animals (48%), beauty (40%) and prank videos (34%). Meanwhile, content exhibiting physical violence (50%), politics (40%), and sexually explicit content (32%) tends to lead to negative emotions.
Two-thirds (65%) have turned a bad day into a good one because of what they’ve seen on social media. Adding to this, respondents were 70% more likely to use social media when they are in a good mood compared to a bad mood and 44% believe social media has a positive impact on their outlook on life.
Over the course of the next five years, 38% believe social media platforms can improve their impact on mental health.
“Algorithms play a significant role in the content we see on social media, but there are simple actions people can take to ‘reset’ their feeds, so they can enjoy more of the positive content they’re craving,” continued Giagrande. “When you come across content that makes you smile, give it some extra attention. ‘Like it’ and leave a comment. Giving that post some engagement can help inspire more positive posts like it to show up on your feed.”
WHAT’S CAUSING GEN Z TO USE SOCIAL MEDIA DAILY?
- Boredom - 66%
- I want to laugh/smile - 59%
- Need a distraction/break - 55%
- I want to see what is happening in the world - 49%
- I want to see what my friends are doing - 44%
- I want to connect with others - 42%
- I want to disengage/need downtime - 33%
- Looking for specific information - 32%
Survey methodology:
Talker Research surveyed 2,000 Gen Z Americans who use social media; the survey was commissioned by LG Electronics and administered and conducted online by Talker Research between June 20 and June 24, 2024.
We are sourcing from a non-probability frame and the two main sources we use are:
● Traditional online access panels — where respondents opt-in to take part in online market research for an incentive
● Programmatic — where respondents are online and are given the option to take part in a survey to receive a virtual incentive usually related to the online activity they are engaging in
Those who did not fit the specified sample were terminated from the survey. As the survey is fielded, dynamic online sampling is used, adjusting targeting to achieve the quotas specified as part of the sampling plan.
Regardless of which sources a respondent came from, they were directed to an Online Survey, where the survey was conducted in English; a link to the questionnaire can be shared upon request. Respondents were awarded points for completing the survey. These points have a small cash-equivalent monetary value.
Cells are only reported on for analysis if they have a minimum of 80 respondents, and statistical significance is calculated at the 95% level. Data is not weighted, but quotas and other parameters are put in place to reach the desired sample.
Interviews are excluded from the final analysis if they failed quality-checking measures. This includes:
● Speeders: Respondents who complete the survey in a time that is quicker than one-third of the median length of interview are disqualified as speeders
● Open ends: All verbatim responses (full open-ended questions as well as other please specify options) are checked for inappropriate or irrelevant text
● Bots: Captcha is enabled on surveys, which allows the research team to identify and disqualify bots
● Duplicates: Survey software has “deduping” based on digital fingerprinting, which ensures nobody is allowed to take the survey more than once
It is worth noting that this survey was only available to individuals with internet access, and the results may not be generalizable to those without internet access.
15
views

Why most car owners are taking better care of their vehicles these days
According to new research, inflation is causing Americans to take better care of their current vehicle.
A survey of 2,000 car owners revealed 73% of respondents have made a conscious decision to better maintain their car, due to rising vehicle costs.
This was especially true for older respondents. While 60% of Gen Z said they’re making an active effort to better maintain their car, 75% of Gen X said the same.
But regardless of age, car owners are considering the cost of a new vehicle as well as past maintenance mistakes (28%) when thinking about the products they choose for their cars.
The survey, conducted by Talker Research on behalf of Pennzoil, looked at the ways in which vehicle owners are taking better care of their cars — and how this connects to the products they’re buying.
The respondents who rely on premium brand name recognition when shopping for products say premium brands work and perform better over time, compared to private-label products, and are more trustworthy than their private-label counterparts.
Those purchasing private-label products may be having regrets.
When asked which private-label products they most regret buying in the last month, private-label products for vehicle maintenance ranked in the top three, along with personal care items and cleaning products.
This desire for brand name products was a consistent theme throughout the survey.
Respondents were shown a variety of categories and asked if they’d prefer to buy a brand name product over a private-label product in each category.
Vehicle maintenance ranked second for most likely to buy brand names. In fact, Americans are significantly more likely to buy a brand name product (57%) to maintain their vehicle versus a private-label product (34%).
Personal technology, like a laptop, (72%) took first place as the most likely brand name purchase. Other categories closely followed, such as small home appliances (55%) and personal care items (52%).
The survey also asked people how maintenance is typically performed on their vehicles: Are they a “do-it-yourself” (DIY) consumer, or a “do-it-for-me” (DIFM) type?
Nearly 80% of consumers say they rely on someone else (DIFM) to do simple maintenance for them on their vehicle, with half of those preferring to hire a professional and 27% relying on a friend or family member to do it for them.
Twenty percent do their own maintenance, with over 40% of DIYers stating they enjoy maintaining their vehicle.
For those who prefer to take their car to the shop, more than half (58%) said it’s because they don’t have the necessary knowledge to maintain it themselves.
And the majority of “do-it-for-me” car owners (57%) also reported brand familiarity has an impact when making a purchasing decision.
But regardless of whether they’re a DIYer or a DIFM consumer, two-thirds of the respondents (63%) said motor oil was one product they’re willing to invest more money into, to protect their car’s value over time.
Survey methodology:
This random double-opt-in survey of 2,000 American car owners was commissioned by Pennzoil between May 24 and May 29, 2024. It was conducted by market research company Talker Research, whose team members are members of the Market Research Society (MRS) and the European Society for Opinion and Marketing Research (ESOMAR).
10
views

Average American needs 60 ‘lazy days’ a year
Americans need 60 lazy days per year to feel rested and relaxed, according to a recent survey.
The poll of 2,000 Americans investigated how the average person leverages days literally doing nothing for self-care as well as the anatomy of a perfect do-nothing day.
It turns out Americans take lazy days very seriously, with one in five (21%) planning their lazy days in advance and 67% opting to take their lazy days spontaneously.
Although a forward-thinking few (11%) even put their do-nothing days on the calendar a few weeks ahead of time.
Conducted by Talker Research on behalf of Berkshire Blanket & Home Co. for National Lazy Day on Aug. 10, the poll found that almost three-quarters (72%) are likely to fly under the radar and won’t tell others they’re taking a day to relax at home.
Looking closer at lazy day trends, Americans are most likely to take lazy days on Sundays (39%) and Saturdays (27%).
And the most unpopular lazy day turns out to be Tuesday, according to findings, with only 5% labeling Tuesday as their go-to lazy day.
When it comes to lazy day activities, or lack of, respondents shared how much time they spend attached to their phones, lounging around and soaking in the self-care.
On a typical lazy day, the average person spends two hours lying in bed, an hour eating, three hours binge-watching movies and TV, an hour reading and two hours scrolling.
Three hours are spent doing literally absolutely nothing, two hours are spent napping and a full hour is generally devoted to dreading the next day.
“In honor of National Lazy Day, we wanted to see how Americans rest and rejuvenate during a much needed-lazy day,” said Mei Higgins, vice president of merchandising of Berkshire Blanket & Home Co. “Everyone deserves a rest day here and there, maybe even a bit more often, and days like these are so important when it comes to wellness. The study even found that almost three in four people (74%) said lazy days are crucial when it comes to self-care.”
The study revealed the top feelings that prompt Americans to take lazy days are low mood and energy (55%), burnout (39%) and feeling overwhelmed by responsibilities (34%).
A third even admitted they’ll take a lazy day if they want to avoid people and one in ten (9%) said an existential crisis is enough to warrant a lazy day.
Uncovering where people like to hang out on a lazy day, most (58%) will kick back on the couch. Although some (4%) said they spend most of their time lying on the floor.
Most people (75%) are more likely to spend the day lounging around if the weather is cool and gloomy and top essentials for do-nothing days, according to respondents, are a comfy outfit (47%) and a cozy blanket or throw (40%), along with a clean home (40%), a shower (40%) and ample junk food (39%).
Respondents aligned to classify the ideal lazy day comfy outfit and said it’s breathable (51%) and lightweight (50%). And the perfect cozy blanket is fluffy (66%) and big enough for two (31%).
“If you weren’t planning to already, we encourage everyone to spend some time simply resting and relaxing on Aug. 10,” said Higgins. “Giving yourself time to do nothing will go a long way towards health and happiness. And cultivating the perfect cozy space to relax in is key. Gathering cozy essentials and designing a relaxing space is part of self-care.”
AMERICA’S IDEAL LAZY DAY CONSISTS OF:
- 3 hours watching movies and TV
- 3 hours doing absolutely nothing
- 3 hours simply sitting and enjoying one’s living space
- 2 hours in bed
- 2 hours scrolling on one’s phone
- 2 hours napping
- 1 hour eating
- 1 hour reading
- 1 hour listening to an audiobook or podcast
- 1 hour dreading the next day
Survey methodology:
Talker Research surveyed 2,000 general population Americans; the survey was commissioned by Berkshire Blanket & Home Co. and administered and conducted online by Talker Research between July 15 and July 19.
We are sourcing from a non-probability frame and the two main sources we use are:
● Traditional online access panels — where respondents opt-in to take part in online market research for an incentive
● Programmatic — where respondents are online and are given the option to take part in a survey to receive a virtual incentive usually related to the online activity they are engaging in
Those who did not fit the specified sample were terminated from the survey. As the survey is fielded, dynamic online sampling is used, adjusting targeting to achieve the quotas specified as part of the sampling plan.
Regardless of which sources a respondent came from, they were directed to an Online Survey, where the survey was conducted in English; a link to the questionnaire can be shared upon request. Respondents were awarded points for completing the survey. These points have a small cash-equivalent monetary value.
Cells are only reported on for analysis if they have a minimum of 80 respondents, and statistical significance is calculated at the 95% level. Data is not weighted, but quotas and other parameters are put in place to reach the desired sample.
Interviews are excluded from the final analysis if they failed quality-checking measures. This includes:
● Speeders: Respondents who complete the survey in a time that is quicker than one-third of the median length of interview are disqualified as speeders
● Open ends: All verbatim responses (full open-ended questions as well as other please specify options) are checked for inappropriate or irrelevant text
● Bots: Captcha is enabled on surveys, which allows the research team to identify and disqualify bots
● Duplicates: Survey software has “deduping” based on digital fingerprinting, which ensures nobody is allowed to take the survey more than once
It is worth noting that this survey was only available to individuals with internet access, and the results may not be generalizable to those without internet access.
64
views

When do kids get after-school hangry?
Kids’ after-school “hangriness” strikes at approximately 3:36 p.m., according to a recent poll.
The survey of 2,000 parents of kids aged 5 - 17 investigated the highs and lows throughout the school week for both kids and parents and all the ways parents go the extra mile to do it all during the school season.
According to results, kids come home from school hangry (hungry and angry/grumpy at the same time) three days per week, on average. Parents even admitted they’re hangry two days out of the week.
Commissioned by Cabot Creamery and conducted by Talker Research, the survey found that it only takes a few simple things to derail a typical school day.
Top factors that throw kids and parents off include lack of sleep (54%), running late to school (39%), hangriness (27%) and crashing during the day due to not eating enough high-quality food (22%).
For most respondents (61%), the whole day can feel “off” if the family falls behind schedule while getting ready for the day.
And there’s not much wiggle room to lag on school mornings as parents reported they only have 33 minutes, on average, between waking their kids up and running out the door to school.
So, unsurprisingly, 40% of respondents said getting their kids ready for school in the morning is the most stressful part of their day and a third (29%) admitted school mornings at their house are chaotic.
And within those 33 minutes from wake time to go time, more than half of parents (52%) are packing their kids’ school lunches.
"Nutrition plays a huge role in keeping your energy levels and mood even-keeled," said Sara Wing, a nutritionist at Cabot Creamery. "Stocking up on convenient, nutrient-dense snacks that are high in protein like cheddar cheese, whole grain crackers and nuts can help fuel your family through the day."
Looking into how parents forward-plan to combat moody lows, many will have pre-made snacks waiting for their kids when they arrive home from school (37%), stash extra snacks in their kiddos’ backpacks, that they can snack on throughout the day (33%) and make after-school snacks together at home (29%).
And when asked about tips and tricks to keep their kids healthy and fueled while on the go, parents said to keep snacking simple, forward-plan and stock up on snack foods and have kids pick out snacks they like, that they’ll be excited to eat throughout the week.
Most kids (53%) first order of business after school is to get a snack and must-have snacks, according to parents, are fruit (64%), crackers (49%), granola bars (47%), yogurt (47%) and cheese (46%).
Looking at snacks through a health lens, respondents' definition of a healthy snack for their kids includes being easy to prepare (69%), high in protein (52%) and vitamin and nutrient-dense (51%), and most (77%) agree that having quick, healthy snacks for their child makes the day run more smoothly.
Kids’ autonomy is also important to parents when it comes to choosing snacks, as more than eight in 10 (85%) said it’s important that their kids have snack and meal options they can prepare for themselves.
For those that have quick and healthy meal/snack options for their kids (85%), nine out of 10 agree that quick snack and meal options free up more time for quality time together.
And almost seven in 10 respondents (68%) shared that after-school snack time is a special bonding time between them and their child.
"Snacking shouldn't be stressful," said Wing. "Simple changes to your routine like packing lunch the night before, prepping meals in advance or buying healthy grab-and-go snacks for the kids — and yourself — can help free up time during the school week."
Survey methodology:
Talker Research surveyed 2,000 American parents of school-aged children (ages 5 - 17); the survey was commissioned by Cabot Creamery and administered and conducted online by Talker Research between July 3 and July 8, 2024.
We are sourcing from a non-probability frame and the two main sources we use are:
● Traditional online access panels — where respondents opt-in to take part in online market research for an incentive
● Programmatic — where respondents are online and are given the option to take part in a survey to receive a virtual incentive usually related to the online activity they are engaging in
Those who did not fit the specified sample were terminated from the survey. As the survey is fielded, dynamic online sampling is used, adjusting targeting to achieve the quotas specified as part of the sampling plan.
Regardless of which sources a respondent came from, they were directed to an Online Survey, where the survey was conducted in English; a link to the questionnaire can be shared upon request. Respondents were awarded points for completing the survey. These points have a small cash-equivalent monetary value.
Cells are only reported on for analysis if they have a minimum of 80 respondents, and statistical significance is calculated at the 95% level. Data is not weighted, but quotas and other parameters are put in place to reach the desired sample.
Interviews are excluded from the final analysis if they failed quality-checking measures. This includes:
● Speeders: Respondents who complete the survey in a time that is quicker than one-third of the median length of interview are disqualified as speeders
● Open ends: All verbatim responses (full open-ended questions as well as other please specify options) are checked for inappropriate or irrelevant text
● Bots: Captcha is enabled on surveys, which allows the research team to identify and disqualify bots
● Duplicates: Survey software has “deduping” based on digital fingerprinting, which ensures nobody is allowed to take the survey more than once
It is worth noting that this survey was only available to individuals with internet access, and the results may not be generalizable to those without internet access.
78
views

Gen Z, millennials no longer relaxing while on vacation
Younger Americans think relaxing on vacation is overrated, according to new research.
A survey of 2,000 Americans who travel (evenly split by generation) looked at how people of different ages vacation and found both Gen X (51%) and baby boomers (57%) prioritize relaxation when traveling; whereas, Gen Z (54%) and millennials (45%) are more interested in making memories.
In fact, 29% of those who don’t prioritize relaxation when they’re away find it to be a waste of time — especially millennials (30%).
Conducted by Talker Research for Apple Vacations, the survey found that these preferences may change in the future, as 59% shared their vacation priorities have shifted as they got older.
A quarter of millennials reported that sightseeing is a thing of the past and Gen Z is no longer prioritizing learning new things while traveling (28%).
Respondents from different generations recalled the average age they were when their vacation preferences changed. Gen Z preferences shift at age 18, while millennials see it at 27, Gen X at 38 and baby boomers at 54.
Something that won’t change is Americans’ love for traveling, with one in four sharing that traveling is a high priority for them these days (28%).
Although millennials are most focused on traveling right now (38%), Gen Z (35%) is most likely to surpass the average number of trips taken annually.
Looking at the differences in how they enjoy this time away, results showed that baby boomers (74%) prefer domestic travel, while Gen Z (14%) is the most likely to enjoy international travel.
Family-friendly (33%) and tropical (27%) destinations are favored across the generations, but Gen Z (25%) and millennials (24%) also share a strong love for theme parks.
Aside from their top picks, Gen X (21%) and baby boomers (24%) are also drawn to small towns.
“Relaxation looks and feels different for everyone,” said Dana Studebaker, vice president of marketing at Apple Vacations. “I feel most relaxed when reading a great book on the beach knowing that all I need is at my fingertips at an all-inclusive resort, but others feel renewed after a beautiful backpacking trip through the mountains, soaking up history in a big city. This is the beauty of travel, your vacations can evolve with your preferences.”
Before their trip, Gen Z is especially keen on creating a vacation plan (60%) and baby boomers are the likeliest to go with the flow (40%).
Gen X (53%) and baby boomers (65%) who prefer going with the flow agree that this helps them avoid feeling rushed or tied to a plan.
Planners find comfort in mapping their day (56%) and say it helps them make the most of their time (54%).
Gen Z embraces the safety they feel when planning things out (46%), while baby boomers who prefer to plan ahead also enjoy the feeling of checking off things they want to do (50%).
When travel planning, millennials are most likely to use a travel agent (18%), while Gen Z leans heavily on social media for planning (55%) and inspiration (66%).
Older generations prefer to keep things more classic, with Gen X trusting word of mouth (44%) and baby boomers referencing travel magazines or websites for advice (34%).
Before vacationing, millennials are the likeliest to read restaurant menus (34%); instead, Gen X looks at pictures others have posted (36%).
Gen Z respondents are most likely to look at how much things cost and the currency exchange (49%), as well as the transportation options (43%).
Looking ahead, half of respondents plan to travel more as they get older.
Gen Z will take advantage of this the most (73%), planning to travel with their friends (43%), while baby boomers will travel to connect with other family members (20%).
Family is top of mind for those who traveled with their parents when growing up, with 77% planning to continue the tradition of traveling with their kids to bond (66%) and make new memories (65%).
“Getting out of the house and spending quality time with family while traveling is the best way to build memories,” said Michael Lowery, senior vice president and global head of consumer business units at Apple Vacations. “When traveling with a larger group with many ages to keep in mind, I always go for an all-inclusive resort because any worries about entertaining different ages are taken care of. Some guests may enjoy a day at the spa and others can safely be thrilled with resort excursions and activities.”
DESTINATIONS AMERICANS WOULD HAVE LIKED TO VISIT WHEN THEY WERE YOUNGER
● Italy
● Hawaii
● Paris
● England
● India
● Tahiti
● Tokyo
● Cancun
● Greece
● New Orleans
● Spain
● China
● Holland
● Bora Bora
● The Caribbean
● Disney World
● Los Angeles
● Bahamas
● Jamaica
● Ireland
Survey methodology:
Talker Research surveyed 2,000 Americans who travel evenly split by generation; the survey was commissioned by Apply Vacations and administered and conducted online by Talker Research between June 20 and June 27, 2024.
We are sourcing from a non-probability frame and the two main sources we use are:
● Traditional online access panels — where respondents opt-in to take part in online market research for an incentive
● Programmatic — where respondents are online and are given the option to take part in a survey to receive a virtual incentive usually related to the online activity they are engaging in
Those who did not fit the specified sample were terminated from the survey. As the survey is fielded, dynamic online sampling is used, adjusting targeting to achieve the quotas specified as part of the sampling plan.
Regardless of which sources a respondent came from, they were directed to an Online Survey, where the survey was conducted in English; a link to the questionnaire can be shared upon request. Respondents were awarded points for completing the survey. These points have a small cash-equivalent monetary value.
Cells are only reported on for analysis if they have a minimum of 80 respondents, and statistical significance is calculated at the 95% level. Data is not weighted, but quotas and other parameters are put in place to reach the desired sample.
Interviews are excluded from the final analysis if they failed quality-checking measures. This includes:
● Speeders: Respondents who complete the survey in a time that is quicker than one-third of the median length of interview are disqualified as speeders
● Open ends: All verbatim responses (full open-ended questions as well as other please specify options) are checked for inappropriate or irrelevant text
● Bots: Captcha is enabled on surveys, which allows the research team to identify and disqualify bots
● Duplicates: Survey software has “deduping” based on digital fingerprinting, which ensures nobody is allowed to take the survey more than once
It is worth noting that this survey was only available to individuals with internet access, and the results may not be generalizable to those without internet access.
33
views

How long does the buzz of a good bargain last?
On average, the buzz of a good bargain lasts about three and a half hours, according to new research.
A survey of 2,000 Americans examined their shopping habits and pinpointed the precise amount of time that post-purchase glow lasts for, with 216 minutes being the average.
One in 10 respondents stay on cloud nine for the rest of the day, with nearly a quarter of those surveyed riding the wave of a good deal for at least four hours (22%).
Conducted by Talker Research for Ollie’s, the survey found that shoppers won’t be shy about their spoils, either: 59% would brag about finding a good deal to friends (51%), their partner (40%) and members of their extended family (27%).
62
views
The pros and cons of having adult kids living at home
Eighty-five percent of parents whose kids previously moved out are delighted their birds came back to the nest, according to new research, conducted by Talker Research for BOK Financial.
A survey of 2,000 parents of kids in their 20s who live at home aimed to figure out what this experience of having their 20-something children at home has been like and uncovered some interesting trends.
Four in 10 had children who initially moved out (42%) — while 58% said their children have always lived at home.
For those who spread their wings and left their parent’s house, the top reasons were to experience living on their own (41%), go to college (29%) or to live with a partner (26%).
12
views
1
comment

Things Americans forget the most when traveling
Nine in 10 Americans have had a “Home Alone” moment — realizing they forgot something essential en route to their destination, according to new research.
While respondents aren’t forgetting their kids at home, they have forgotten a charger (34%), toiletries and beauty products (32%), sunscreen (27%) and even medication (18%).
That’s according to a survey of 2,000 U.S. adults, commissioned by Crystal Geyser Alpine Spring Water and conducted by Talker Research, which looked at the most inconvenient things respondents have forgotten including socks (17%), water bottles (14%) and even their wallet (8%).
Results also found that 37% admit they’re more forgetful when traveling and, on average, three items are left behind every trip.
51
views

Survey reveals America’s snacking habits
The average American skips about three meals per week, according to new research.
A survey of 2,000 U.S. adults revealed only 22% say that they never skip meals, compared with 29% who admit they do so every single day of the week.
Results also found that Americans aren’t just missing meals, they’re also forgetting what they are actually consuming. The average respondent can only remember barely half (57%) of everything they ate over the last three days.
Still, Americans average three snacks per day. Those range from chips (57%), to fruit (56%) and cheese (46%). Others find themselves snacking on crackers (43%), cookies (41%) and ice cream (36%).
Only 25% of respondents say they’re “very aware” of the daily nutritional value of protein their snacks offer.
This may be because more than one-third of Americans (36%) tend to impulsively consume their snacks rather than intentionally plan them (18%).
Conducted by Talker Research on behalf of Breakstone’s, the survey also explored the concept of “unintentional snacking”, or eating for reasons not necessarily due to hunger, and found that it regularly plagues 30% of Americans.
Only six percent say they don’t fall victim to unintentional snacking.
As a result, respondents have created bad snacking habits (26%) or lacked energy (21%).
But Americans seem to be taking matters into their own hands, as 27% are working to make more informed snacking choices this year.
According to the results, intentional snacking means choosing snacks that are healthy (43%) or that will give them an energy boost (30%).
For others, it looks like setting a limit on how many snacks they have per day or planning the snack ahead of time (both 29%).
In fact, almost half (49%) of respondents would be more likely to eat intentional snacks if they knew there were health benefits — including hard-boiled eggs (43%), Greek yogurt (39%) and cottage cheese (31%).
“With so many Americans skipping meals on a regular basis, it’s important to make the most of your daily snacks,” said Dhriti Batra, Brand Director, Cultured, Lactalis Heritage Dairy. “Try incorporating protein-packed ingredients into snacks such as smoothies or salads. There’s no need to only stick with your same old go-to snacks; trying something new can expand your palate and even reveal new favorites.”
The survey also explored how Americans are making the most of their breaks and revealed that snacking is an integral part of life’s in-between moments.
Results found that Americans average four hours of free time each day and fill that time by watching TV (69%), scrolling through social media (48%) and of course, snacking (40%). And ideally, that break would last for about an hour and 15 minutes (74.7 minutes).
Yet still, 37% of respondents admit they frequently still feel like they’re “running on E” following their breaks.
More than three-quarters of respondents (78%) agree that they relish in even a few moments of downtime.
“The survey results found that almost two in five people don’t feel refueled after their breaks. Between work, school, chores and everything in between, it’s no secret that Americans need some downtime,” said Batra. “While it’s important to relax and unwind, it’s equally as important to nourish your body during breaks so the rest of your day goes smoothly.”
Survey methodology:
This random double-opt-in survey of 2,000 general population Americans was commissioned by Breakstone’s between June 10 and June 13, 2024. It was conducted by market research company Talker Research, whose team members are members of the Market Research Society (MRS) and the European Society for Opinion and Marketing Research (ESOMAR).
44
views

Are American parents playing with their kids enough?
The average child spends about 10 hours playing with their parents, others and on their own on any given day, according to new research, conducted by Talker Research on behalf of The Goddard School.
A new survey of 2,000 parents of children ages 0-6 revealed that three-quarters of parents still believe that isn’t enough and want their child to spend more time engaging in creative, free play time.
According to almost every parent (92%), their child’s play is important for their overall growth and development.
The survey revealed that children spend about three and a half hours playing with their parents each day, while three hours are spent playing on their own and the other three are spent playing with friends, siblings or classmates — this totals nearly 3,650 hours of play every year.
83
views

1 in 3 think they have a way to strike it rich
One in three Americans has an idea they think could one day make them wealthy, according to new research.
From writing the next big novel to a hot stock tip or never-before-seen product, the survey saw 33% say they feel they have a tantalizing idea they think could make waves in the market.
And if that doesn’t come to fruition, there’s always hope–one in five of those polled (19%) have a feeling in their bones that they’ll one day win big on the lottery or Powerball.
The survey, conducted by Talker Research in partnership with Wealth of Geeks saw many (17%) of those with a wealth-generating idea say they have an idea that involves inheritance or using family money.
Men were significantly more likely to feel confident that their idea was going to make them wealthy one day (39% vs. 26% of women).
Forty percent of those currently holding onto a wealth-driving idea want to start a business or service, while 27% have a stock tip they feel has the potential to bring them fortune.
Does “Shark Tank” await? A quarter (26%) of those with a big idea think they’ve thought of a game-changing product that’s not been done before.
From energy-creating mushrooms to a new type of burger or fresh ideas using AI to blow away the competition, many Americans are quietly working away on their big hope for later-day success.
A new type of ceiling fan, ideas for a new social media platform or plans to launch an irresistible food truck were also among the broad concepts Americans said they were hatching plans for.
Many are also putting hope in their creative endeavors by working on the next great American novel or developing the music they one day hope to share with the world.
But while many harbor an optimism that their finances could take a turn for the better, not all of us have faith that fortune will come our way.
Just 10% of those polled describe themselves as ‘very lucky’ when it comes to money with 21% ‘somewhat lucky.’
Forty-three percent felt their financial luck didn’t go either way and sadly 26% felt unlucky with money (12% very unlucky).
That might be why 39% say they’ll need some sort of luck or financial windfall in order to be comfortable later in life and 10% are relying on inheritance to feel the same way.
Survey methodology:
This random double-opt-in survey of 2,000 Americans was commissioned between June 21 and June 24, 2024. It was conducted by market research company Talker Research, whose team members are members of the Market Research Society (MRS) and the European Society for Opinion and Marketing Research (ESOMAR).
65
views

Pregnancy vs. Postpartum: Which stage do majority of moms find harder?
Forty-one percent of moms said pregnancy did not go as planned, according to new research.
The survey of 2,000 American moms looked at their experience while pregnant and found that 39% created a game plan for themselves while pregnant — although one in four (25%) weren’t able to stick to it.
But the journey only starts with pregnancy: seven in ten (71%) admitted they didn’t know what to expect from motherhood postpartum, although the mothers had mixed feelings about which stage was more difficult.
While 25% said pregnancy was more difficult than the postpartum phase, 28% said postpartum was harder and 34% said both were equally challenging.
Conducted by Talker Research for Motherlove Herbal Company, the survey examined the complex and nuanced blend of challenges and changes that come with new motherhood.
The top changes respondents experienced after giving birth were becoming more emotional (47%), having more patience (46%), becoming more aware of their surroundings (44%), listening to their intuition more (40%) and becoming more gentle (37%).
However, the majority (59%) wish their doctor had given them more education about the different things that may happen to their bodies postpartum.
And six in ten (62%) believed that the changes they experienced in their life and body after becoming a mom were unique to them.
When experiencing strange and unique changes to their body postpartum, the moms sought advice from doctors (37%) and their own parents or grandparents the most (35%).
Although moms of younger kids were more likely to consult doctors (44% vs. 35%) and other moms (36% vs 25%), compared to moms with older kids.
But regardless of age, 59% disclosed that when they first entered motherhood, they wished for more mom friends to discuss the experience with.
And while a third (30%) said their parenting experience has been similar to their mother’s, 46% say it’s been different.
“Motherhood is full of many unexpected challenges to navigate, especially for new moms," said Katherine DeBease, new mom and marketing director at Motherlove Herbal Company. "Over the past 40 years, our priority has been to connect motherhood to Mother Earth by providing herbal remedies that empower them throughout their motherhood journey. Moms should have peace of mind with clean, simple, plant-based and gentle options for their babies and themselves.”
Forty-two percent of respondents opted to breastfeed, at least sometimes, and this came with an added layer of physical changes and difficulties.
Most common breastfeeding pain points were sore nipples (33%), general soreness (30%) and leaking (29%).
Looking at the emotional and logistical hardships of new motherhood, a third (32%) reported they had a hard time socializing with friends after having their child and almost half (45%) had a hard time going back to work after having their child.
Through a practical lens, 35% had a hard time cleaning their home after having their child and one in three (31%) had a hard time caring for their body after having their child.
So when giving advice to new mothers today, respondents shared wisdom and tips including not to expect perfection, be present and take care of yourself, don’t be afraid to ask for help, use your best instincts and stay positive.
"It's not uncommon to feel like you're alone when you’ve entered the unfamiliar terrain of new motherhood," said Wendy Wisner, board-certified lactation consultant with Motherlove. “When it comes to breastfeeding, I recommend making sure to learn about the basics of breastfeeding, such as the importance of frequent feeding, good latching and how to know if your baby is getting enough milk.
“I also can’t emphasize enough how vital support is, whether it be from a lactation consultant, good friend, or trusted pediatrician. Many new moms need support with breastfeeding, and they shouldn’t hesitate to reach out for it.”
Survey methodology:
Talker Research surveyed 2,000 moms; the survey was commissioned by Motherlove Herbal Company and administered and conducted online by Talker Research between June 12 and June 17, 2024.
We are sourcing from a non-probability frame and the two main sources we use are:
● Traditional online access panels — where respondents opt-in to take part in online market research for an incentive
● Programmatic — where respondents are online and are given the option to take part in a survey to receive a virtual incentive usually related to the online activity they are engaging in
Those who did not fit the specified sample were terminated from the survey. As the survey is fielded, dynamic online sampling is used, adjusting targeting to achieve the quotas specified as part of the sampling plan.
Regardless of which sources a respondent came from, they were directed to an Online Survey, where the survey was conducted in English; a link to the questionnaire can be shared upon request. Respondents were awarded points for completing the survey. These points have a small cash-equivalent monetary value.
Cells are only reported on for analysis if they have a minimum of 80 respondents, and statistical significance is calculated at the 95% level. Data is not weighted, but quotas and other parameters are put in place to reach the desired sample.
Interviews are excluded from the final analysis if they failed quality-checking measures. This includes:
● Speeders: Respondents who complete the survey in a time that is quicker than one-third of the median length of interview are disqualified as speeders
● Open ends: All verbatim responses (full open-ended questions as well as other please specify options) are checked for inappropriate or irrelevant text
● Bots: Captcha is enabled on surveys, which allows the research team to identify and disqualify bots
● Duplicates: Survey software has “deduping” based on digital fingerprinting, which ensures nobody is allowed to take the survey more than once
It is worth noting that this survey was only available to individuals with internet access, and the results may not be generalizable to those without internet access.
99
views

2 in 5 Americans feel like they're stuck living where they are
Soaring housing prices are causing Americans to rethink their “dream home” and “dream workspace,” where luxury is out and practicality is in.
A new poll of 2,000 U.S. adults found 58% have witnessed increased housing costs over the past five years, and 39% frequently feel like they’re stuck living where they are.
Many are also concerned about the affordability of housing (50%), crime (40%) and making home repairs (35%).
Commissioned by Built, the construction and real estate finance technology company, and conducted by Talker Research, the study found Americans currently spend 25% of their monthly income on housing, but would ideally like to spend 19%.
The average prospective homebuyer would need mortgage interest rates to be lowered down to at least 4% before they consider moving to a new house, and 42% would likely consider moving if they were incentivized by a destination’s local programs to buy or build a home there.
Today, 43% of Americans polled rent their homes, while 57% own their homes.
Nearly half (49%) of renters said they prefer renting, though 47% said they’d like to own a home someday — 17% of whom would like to own a home within the next 18 months.
In fact, one-third frequently think about their “dream home,” as well as their “dream workspace.”
“Rising costs are causing people to really rethink what’s actually important to them,” said Tanner Dieterich, head of owner and contractor relations at Built. “If you look back just a few years, people wanted pools and home theaters.”
“Now, data shows they prefer practicality—a minimalist approach that still ensures a good quality of life. But for that to happen, we need to address what’s preventing people from moving in the first place.”
The survey found exactly what Americans are looking for in an ideal home and workspace amid the new era of hybrid work models and an increasing cost of living.
The ideal "dream home" is an average of 2,402 square feet, with 69% of respondents preferring a single-family dwelling over a multi-family building, condo, or townhouse.
Americans also want simple, practical features and amenities like central air conditioning and heating (68%), easy-to-access laundry appliances (55%), a yard or green space (55%) and nearby local amenities (54%).
This beat out more “traditional” ideas of luxury living — having a pool (37%), professional-grade cooking equipment and appliances (32%), manicured landscaping (32%), gym (29%), home theater (28%), greenhouse (24%) and au-pair suits (15%).
A large majority of remote workers (88%) and office workers (71%) agree their workspaces should make them feel comfortable.
Whether it’s at home or in an office, a “dream workspace” has ample natural sunlight (61%), space (55%) and parking (25%).
And if a commute is required, people want features they wouldn’t otherwise have at home: natural light (40%), nearby restaurants and cafés (33%), quiet rooms (33%), dedicated or assigned working spaces (32%) and break rooms (31%). In other words, an office ought to provide what a home office cannot.
With so many dream list items to cross off, it’s not surprising that Americans are yearning for greener pastures. The study found that currently, more than one in five (22%) would give where they live an “A” and 18% would give their place of work a “B”. Both the home and the workplace earned a “B” for amenities and features, however (21% and 19%, respectively).
“Almost 50% of people aspire to homeownership — yet, affordability and available housing remain the primary obstacles,” Dieterich explained. “Once these issues have been addressed, individuals can begin to truly envision their ideal homes and workplaces.”
Survey methodology:
Talker Research surveyed 2,000 general population Americans; the survey was commissioned by Built and administered and conducted online by Talker Research between July 4 and July 8, 2024.
We are sourcing from a non-probability frame and the two main sources we use are:
● Traditional online access panels — where respondents opt-in to take part in online market research for an incentive
● Programmatic — where respondents are online and are given the option to take part in a survey to receive a virtual incentive usually related to the online activity they are engaging in
Those who did not fit the specified sample were terminated from the survey. As the survey is fielded, dynamic online sampling is used, adjusting targeting to achieve the quotas specified as part of the sampling plan.
Regardless of which sources a respondent came from, they were directed to an Online Survey, where the survey was conducted in English; a link to the questionnaire can be shared upon request. Respondents were awarded points for completing the survey. These points have a small cash-equivalent monetary value.
Cells are only reported on for analysis if they have a minimum of 80 respondents, and statistical significance is calculated at the 95% level. Data is not weighted, but quotas and other parameters are put in place to reach the desired sample.
Interviews are excluded from the final analysis if they failed quality-checking measures. This includes:
● Speeders: Respondents who complete the survey in a time that is quicker than one-third of the median length of interview are disqualified as speeders
● Open ends: All verbatim responses (full open-ended questions as well as other please specify options) are checked for inappropriate or irrelevant text
● Bots: Captcha is enabled on surveys, which allows the research team to identify and disqualify bots
● Duplicates: Survey software has “deduping” based on digital fingerprinting, which ensures nobody is allowed to take the survey more than once
It is worth noting that this survey was only available to individuals with internet access, and the results may not be generalizable to those without internet access.
71
views

‘Raging’ sports fans watch this many games a year
Sports fans watch 120 games per year, according to a recent survey.
The poll of 2,000 American sports fanatics uncovered just how emotionally invested fans are, how much they pay to follow along and represent their teams, and how sports have given fans a return on their emotional and financial investments.
Conducted by Talker Research on behalf of SquadLocker, the survey also split sports fans into different categories depending on their level of commitment to their team or player.
A third of respondents (32%) said they’re moderate fans who watch a few sports games here and there, half (48%) labeled themselves as big fans who watch most games and a fifth (20%) are all-in and self-identified as raging fans who watch every single game they can.
But being a raging fan comes with a price tag. Raging fans reported they spend, on average, $879.40 on tickets to live sports games, concessions, apparel, collectibles, memorabilia and streaming services, per year.
Big sports fans said they’ll spend $593.80 and moderate sports fans reported spending $376.10 annually, on average.
When it comes to being present on the sidelines, fans said they’ll usually see about three live wins and two losses, per year.
And respondents estimated they’ve seen five one-of-a-kind, miracle live sports wins, with three quarters (74%) citing watching their favorite team win a live game as a favorite memory.
But not only is there a financial commitment to sports fandom, there’s an emotional commitment as well.
More than one in five fans (22%) have a pre-game ritual or tradition they do each time their favorite team or player competes, with raging fans being the most likely to participate in pre-game rituals (32%).
And while 35% reported their required pre-game traditions simply make them feel like a part of the team, one in three (31%) staunchly feel their pre-game ritual increases their team or player’s chances of winning.
When asked about their pre-game habits, many cited traditions like cookouts, flaunting team gear, tailgating, chanting, dancing and praying.
A few noteworthy respondents take it a bit further and reported lighting candles for their team, obsessively washing their hands and painting their bodies to ensure that their team wins.
“Many people follow along with pro athletes and partake in traditions because it’s a bonding experience and brings people together. Sports are rooted in community and often start when we’re young,” said Fletcher Jones, CEO of SquadLocker. “It is clear just how much sports mean to people by the emotional high they feel after a win and the emotional low after a loss. I think a lot of this comes from so many of us having participated in team sports during our formative years.”
Thirty-nine percent reported that if their team or player loses a match, they feel more sensitive than usual and more than one in 10 (14%) said their general enjoyment of life decreases.
Looking at how playing a sport growing up influences sports fandom, 71% of sports fans reported they played sports as a youth and 28% played in college.
And of those who played sports growing up, almost half (45%) said they dreamed of playing sports as a professional. For a quarter of those, this is still their dream.
And it turns out that turning on the TV or attending a match has a real-life impact on fans: 30% of respondents reported they’d like to pick a sport they used to play after watching the pros and a fifth (19%) even want to try a new sport.
Most popular sports fans are playing (either as an old hobby or a new skill) include basketball (41%), football (26%), baseball (22%) and tennis (16%).
“I think one of the most important results from this survey is how much passion sports fans have for their teams at every level. The support they give enhances their lives as well as the lives of the athletes,” said Kaycie Brown, athlete at 575 Volleyball, a youth sports organization. “We love the family and friends that come and cheer us on and even the ones who watch online and cheer us on from their homes. All athletes need a support system, and the fans play a very large role. Fan support builds confidence and plants seeds for success.”
Survey methodology:
This random double-opt-in survey of 2,000 American sports fans was commissioned by SquadLocker between May 24 and May 29, 2024. It was conducted by the market research company Talker Research, whose team members are members of the Market Research Society (MRS) and the European Society for Opinion and Marketing Research (ESOMAR).
56
views

Why 3 in 5 Americans think the economy is in a recession
Three in five people believe that the U.S. is currently in a recession, even though we’re not in one officially, according to new research.
The survey of 2,000 Americans explored what’s driving this lack of consumer confidence in the economy. Inflation and the rising cost of living (68%) tops the list of reasons why respondents believe the U.S. is in a recession, followed by friends and family members complaining about money (50%).
Conducted by Talker Research on behalf of Affirm, the research found other reasons included noticing friends cutting back on spending (36%) and not being able to pay off credit card debt (20%).
On average, respondents who feel the U.S. is in a recession believe it started over 15 months ago, roughly in March of 2023. And they don’t expect it to go anywhere quickly — they believe this feeling will last until around July of 2025. As a result, some Americans are questioning their own financial futures.
Nearly seven in 10 (68%) of Americans surveyed said the current inflation rate is negatively affecting their future plans, including their ability to save and afford upcoming purchases.
“With confidence in the U.S. economy at a low point, consumers are urgently seeking ways to feel in control of their finances,” said Vishal Kapoor, SVP of Product at Affirm. “Amidst these levels of uncertainty and doubt, we believe that the antidote to the current ‘vibecession’ is greater choice and transparency in how people manage their finances.”
People are adjusting to the current economic environment by turning to budgeting and flexible payment options. Almost all (89%) Americans surveyed said having a predictable monthly budget is a priority when managing their finances.
Transparency is also key, with six in 10 Americans (63%) preferring to see the total cost of a purchase upfront, including any interest charges.
To help them budget and remain in control, Americans are seeking more strategic ways to pay for their purchases. More than half (54%) of Americans surveyed have used or would use “buy now, pay later” options, while nearly half (45%) agree that these options make it easier to stick to a budget and manage their finances.
Additionally, almost one in two respondents (48%) said the availability of 0% APR pay-over-time offers — which allow people to spread out their purchases over the course of several months without paying any interest — affects their purchasing decisions.
“While conversations around money may contribute to the pessimistic outlook on the economy, it also means that people are discovering smarter ways to pay, including options to pay over time without any late or hidden fees,” said Kapoor.
Survey methodology:
This random double-opt-in survey of 2,000 general population Americans was commissioned by Affirm between June 20 and June 24, 2024. It was conducted by market research company Talker Research, whose team members are members of the Market Research Society (MRS) and the European Society for Opinion and Marketing Research (ESOMAR).
42
views

Americans spend 54 hours per year online shopping
Americans are so focused on saving money that four in 10 are more likely to bring up a recent spend in conversation if they scored a good deal on it — so they can brag about their find.
That’s according to a new survey of 2,000 general population Americans, which revealed 42% want to chat about their great finds.
Not only that, but eight in 10 respondents are excited to share their secrets: they want to tell others where they, too, can find the best deal.
Nationwide, the average respondent spends 62 minutes shopping online each week — adding up to about 54 hours per year.
Conducted by OnePoll and commissioned by Citi for the Citi Shop browser extension, the survey looked at Americans’ shopping habits and their dedication to finding deals.
Within this, the survey revealed that for 52% of respondents, their online shopping habit has increased in the past year. While online shopping, 71% said the most important thing is the item’s price, even more so than the product’s quality (46%).
And with price as the most important factor, six in 10 Americans surveyed “always” or “often” look for a promotion code or other offer before checking out with an online purchase.
If it takes too long to find one, 37% said they won’t proceed with their purchase.
Younger generations were the most likely to abandon their purchase if they couldn’t find a deal — 51% of Gen Z and 46% of millennials surveyed agreed with this.
The results also revealed that 53% of respondents have items they’ll never pay full price for — only purchasing them if there’s a deal.
“American consumers live busy lifestyles and online shopping has become a way of life,” said Anthony Merola, Head of Proprietary Products for U.S. Branded Cards at Citi. “Today’s shopping tools, including browser extensions, have become a go-to resource for people to conveniently save on time and money.”
With this dedication to finding deals, perhaps it’s no surprise that three-quarters (77%) of those surveyed self-identified as “savvy shoppers.”
Furthermore, a third of Americans believe finding deals is their “shopping superpower,” with 34% selecting this as their “superpower” and beating out other
options like getting free shipping (18%) or spotting quality items (12%) online.
When they save money, shoppers surveyed are most likely to use those savings to then treat themselves (26%).
They also might use their savings to pay off a bill (26%) or spend it on other essentials (26%). Additionally, shoppers surveyed said they would put the extra money in their savings account (25%) or use it to shop more (20%).
As seasonal shopping approaches, the survey looked at the extra mile some respondents would go, in order to get a good deal. Nationwide, one in 10 (11%) would be willing to wait in line for hours, while 15% of shoppers would set an alarm to remind themselves.
More commonly, shoppers would download a specific app or browser extension (32%), make a “game plan” (26%) or browse from multiple devices (26%).
“Now, with more convenient ways to find deals with shopping tools, everyone can be a savvy shopper,” explained Merola. “You don’t have to worry about searching for deals when your shopping automatically searches behind the scenes for savings at your favorite online merchants.”
Survey methodology:
This random double-opt-in survey of 2,000 general population Americans was commissioned by Citi between March 22 and March 28, 2024. It was conducted by market research company OnePoll, whose team members are members of the Market Research Society and have corporate membership to the American Association for Public Opinion Research (AAPOR) and the European Society for Opinion and Marketing Research (ESOMAR).
27
views

What are parents willing to do to save on school supplies?
Three in four parents would try “any” workaround to save money on school supplies — with some even dumpster diving and stealing from work — finds a new survey.
A poll of 2,000 U.S. parents of elementary school kids found 77% believe staying under their budget is top priority for them.
The top resources parents have used to keep their back-to-school shopping under control include: purchasing school supplies whenever they go on sale, even after back-to-school season (49%) and shopping at multiple stores for the best deal (45%).
Commissioned by The Krazy Coupon Lady and conducted by Talker Research, many others said they’d also try to save money by wilder means.
They would try hoarding school supplies throughout the year (37%), shopping exclusively when there’s a deal (34%), extreme couponing (22%), looking for half-used items around the home (16%), joining buy-nothing groups on social media (10%), trading supplies with other parents (9%) and dumpster diving (5%).
And 12% admitted to stealing supplies from their workplace to give to their kids as school supplies.
Over half (57%) would also be willing to save money by group buying school supplies with other parents — purchasing certain items in bulk and then splitting the cost amongst the group.
The most likely supplies to be group-bought include pens and pencils (67%), art supplies (59%), notebooks (58%), folders (54%), glue and tape (52%) and desk accessories (47%).
“The reality is, parents are worried about what back-to-school shopping costs look like this year,” said Joanie Demer, co-founder and co-CEO at The Krazy Coupon Lady. “We’re seeing parents embracing getting creative with their budgeting. It’s clear that they want to save as much as possible when they prepare their kids for school — and that shouldn’t be a chore for them to do.”
While two in three parents reported feeling prepared for back-to-school shopping this year, the results also found 82% believe the cost for supplies has increased in the past year; especially for clothing (59%), shoes (51%), backpacks (50%) and school uniforms (26%).
On average, parents anticipate spending $280 on supplies this year.
Nearly all (95%) said they prefer to include their kids when shopping, but 64% believe they spend more money when their kids are present, spending an average $101 more on supplies if their kids tag along.
Forty-four percent of parents said they would consider giving their kids money of their own to spend on school supplies, but many believe their kids would end up using it on snacks (42%), candy (38%) and games (33%) over actual school supplies (32%).
The study also found kids are more concerned about their school supplies being name-brand than parents (41%, compared to 36%).
Nearly three in five (59%) feel like their kids pester them to buy a certain school supply item name brand on occasion.
Some parents shared what their kids have requested: Under Armour backpacks and clothing, Stanley tumblers and bottles, Nike and Jordan shoes, Mead notebooks and Crayola crayons.
“There’s a number of things parents can do to beat the costs,” continued Demer. “Start by comparing prices before you purchase, waiting for a sale, and paying attention to the clearance shelves. Parents deserve to have as many resources as they can gather to support their wallets and their peace of mind.”
HOW ARE PARENTS STAYING UNDER BUDGET?
- Purchasing school supplies whenever it goes on sale - 49%
- Shopping at multiple stores for the best deal - 45%
- Saving school supplies throughout the year - 37%
- Shopping exclusively when there’s a deal - 34%
- Extreme couponing - 22%
- Looking for half-used items around the home - 16%
- Joining buy-nothing groups on social media - 10%
- Trading supplies with other parents - 9%
- Dumpster diving - 5%
Survey methodology:
Talker Research surveyed 2,000 parents of elementary school-aged children; the survey was commissioned by Krazy Coupon Lady and administered and conducted online by Talker Research between July 1 and July 8, 2024.
We are sourcing from a non-probability frame and the two main sources we use are:
● Traditional online access panels — where respondents opt-in to take part in online market research for an incentive
● Programmatic — where respondents are online and are given the option to take part in a survey to receive a virtual incentive usually related to the online activity they are engaging in
Those who did not fit the specified sample were terminated from the survey. As the survey is fielded, dynamic online sampling is used, adjusting targeting to achieve the quotas specified as part of the sampling plan.
Regardless of which sources a respondent came from, they were directed to an Online Survey, where the survey was conducted in English; a link to the questionnaire can be shared upon request. Respondents were awarded points for completing the survey. These points have a small cash equivalent monetary value.
Cells are only reported on for analysis if they have a minimum of 80 respondents, and statistical significance is calculated at the 95% level. Data is not weighted, but quotas and other parameters are put in place to reach the desired sample.
Interviews are excluded from the final analysis if they failed quality-checking measures.
This includes:
● Speeders: Respondents who complete the survey in a time that is quicker than one-third of the median length of interview are disqualified as speeders
● Open ends: All verbatim responses (full open-ended questions as well as other please specify options) are checked for inappropriate or irrelevant text
● Bots: Captcha is enabled on surveys, which allows the research team to identify and disqualify bots
● Duplicates: Survey software has “deduping” based on digital fingerprinting, which ensures nobody is allowed to take the survey more than once
It is worth noting that this survey was only available to individuals with internet access, and the results may not be generalizable to those without internet access.
46
views
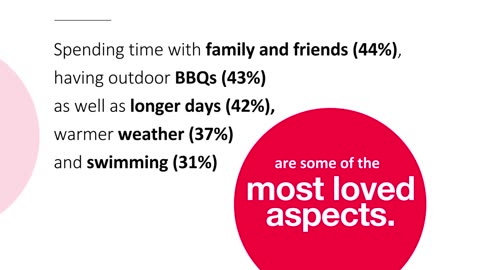
Top factors that can make or break an entire summer season
A new survey has found that the perfect summer must include 14 days with loved ones, eight sunrises watched and 11 dips in the water.
That’s according to a survey of 2,000 U.S. adults, which revealed that summer isn’t summer without a few key experiences.
Spending time with family and friends (44%), having outdoor BBQs (43%) as well as longer days (42%), warmer weather (37%) and swimming (31%) are some of the most loved aspects.
In fact, almost three-quarters (74%) even believe that there are certain factors that can make or break an entire summer season.
Too much heat during the dog days of summer (63%), being sick (61%) or getting injured (49%) ranked as the top three ways to break the season.
On the flip side, summer can be made by spending time with loved ones (65%), getting away from home (55%) and simply being near water (49%).
Conducted by Talker Research on behalf of Boatsetter, an app for boat rentals, charters and on-the-water experiences, the survey explored the concept of the perfect summer and uncovered a by-the-numbers breakdown.
It seems as though these factors are already falling into place as Americans plan to spend two whole weeks with their friends and family this summer.
In fact, almost half (49%) spend the most time with their loved ones during the summer months, compared to the rest of the year.
This summer, Americans are soaking in every moment of sun and plan to watch eight different sunrises and 11 sunsets. They’re also basking in the sun between those two markers and plan to endure one sunburn and go through an average of two bottles of sunscreen.
Americans plan to get in the water 11 times this summer, often in a pool (64%), the ocean (36%) or a lake (29%).
They’re also getting in the water an average of seven days by way of boating (27%), tubing (27%), or kayaking (8%).
Fishing (32%), sunset cruises (25%) and dock-and-dining (17%) were also found to be some of the most popular on-the-water activities this summer.
Results revealed that 39% of respondents tend to prefer to be on the water than in it, though the total tallies for each are neck and neck (39% vs 30%).
When it comes time to refuel, Americans are planning to enjoy 11 hot dogs and 13 burgers between June and August and also plan to indulge in 11 scoops of ice cream.
All of this further reinforces the need for sea, sun and fun, as the top three fan-favorite summer activities Americans plan to partake in include barbecuing (45%), swimming (36%) and going to the beach (31%).
“It’s clear that Americans take their summer very seriously. Between sun-soaked days, various water activities, and barbeques, this summer season is sure to be one to remember,” said Boatsetter CEO Michael Farb. “Whether you prefer to be in or on the water, there are memories to be made. From diving in to soaking in the views on a boat, there are endless opportunities for summer adventures.”
This summer, Americans are planning an average of three different adventures or short trips and two trips across state lines, totaling an average of a little over $510 ($512.60).
More than half (54%) of respondents also admit that they are more adventurous during the summer than any other season.
This may be why the average American is planning to try five new experiences this summer, including, “going on a boat,” “traveling to a state I've never been,” “exploring new beaches, new lakes, new rivers,” and even “find[ing] some new friends to go out to karaoke with.”
“Whether you’re looking for new experiences or simply to spend time with your loved ones this summer, there are ways to ensure it’s the best one yet,” said Farb. “With so many Americans looking to try something new, like going on a boat, the perfect summer is right around the corner.”
Survey methodology:
This random double-opt-in survey of 2,000 general population Americans was commissioned by Boatsetter between June 18 and June 24, 2024. It was conducted by market research company Talker Research, whose team members are members of the Market Research Society (MRS) and the European Society for Opinion and Marketing Research (ESOMAR).
34
views

Top things parents are cleaning all wrong
One in three parents are learning they’ve been cleaning things wrong their entire lives, according to a new study.
The poll of 2,000 U.S. parents revealed many have been told by others they incorrectly fold laundry (33%), mop and sweep wrong (28%) and don’t know how to properly wash laundry (26%).
Are mom and dad to blame? Forty percent have witnessed their own parents also “cleaning the wrong way” and 47% have tried to correct them.
Many recall never being taught how to mow the lawn (26%), garden or do yard work (25%) and how to properly load the dishwasher (24%).
Commissioned by PINALEN Multipurpose Cleaner and conducted by Talker Research, the study showed a majority of people still credit their upbringing for showing them how to properly fold laundry (72%), do dishes by hand (70%), wash laundry (69%) and how to mop or sweep (65%).
And for some, their families weren’t the only resource for learning how to clean: people said they also learn to clean from their past or current jobs (37%), from their significant other (31%) and from their friends (27%).
As a result, 17% claim to be “near-sterile” in their households, keeping everything clean all the time. An additional 60% said they were “pretty clean” at home, accepting a little mess here and there.
Sixteen percent admitted they don’t pay attention to how clean something is, as long as it’s organized and tidy.
"Cleaning can be surprisingly subjective. The 'proper' way to clean can vary greatly depending on your culture, how you were raised, and who you learned from -- but what truly matters is the effectiveness and reliability of those cleaning techniques," said Tanu Grewal, Chief Cleaning Officer at PINALEN Multipurpose Cleaner. "At the end of the day, parents play a crucial role in shaping their children's cleaning habits and attitudes, instilling good practices that last a lifetime."
Results also found 76% of parents plan on teaching their kids everything about cleaning that they were never taught, and 86% have already thought of how they’ll teach their kids cleaning habits.
In fact, 73% believe how they learned to clean growing up could have had a positive impact on how they clean today. And for 65% of them, cleaning is now considered an art form.
Parents believe it’s important their kids learn how to keep organized (75%), what types of cleaning products to use (69%) and how much soap or detergent to use while cleaning (68%).
For most chores — folding laundry, washing dishes, floor cleaning and taking out the trash — parents believe their kids can start participating by age 10. Meanwhile, chores like starting the laundry machines, yard work, cleaning furniture and cleaning the toilet can all wait until age 11.
By age 12, parents believe their kids can handle cleaning out the fridge; and by 13, parents said their kids can take on lawn mowing.
Instead of viewing it as a chore or punishment, 88% of parents believe cleaning can be made into a family activity — leaning into making cleaning something that brings everyone in the house together in a joyful, collaborative way.
And to make cleaning fun, they’ll play music in the background (75%), sing while cleaning (41%) and dance while cleaning (38%).
“Overall, people are taught objective aspects of cleaning such as how much product to use, specific techniques, and how to use cleaning tools or machines, but are left to figure out their own personal preferences,” continued Grewal. “Regardless of whether they believe each chore is done right or wrong, most people still associate positive feelings with cleaning and it reminds them of home.
“Cleaning is part of everyone’s heritage one way or another – whether you learned how to clean from your parents or want to start your own cleaning traditions with your children, it is something that is passed down through generations.”
TOP 10 CLEANING TASKS PARENTS HAVE BEEN TOLD THEY DO WRONG
- Folding laundry - 33%
- Mopping/sweeping - 28%
- Doing laundry - 26%
- Loading the dishwasher - 25%
- Doing dishes by hand - 23%
- Gardening/yard work - 21%
- Mowing the lawn - 18%
- Cleaning the toilet - 17%
- Cleaning furniture - 16%
- Dusting - 16%
Survey methodology:
This random double-opt-in survey of 2,000 American parents of school-aged kids was commissioned by AlEn between June 14 and June 18, 2024. It was conducted by market research company Talker Research, whose team members are members of the Market Research Society (MRS) and the European Society for Opinion and Marketing Research (ESOMAR).
89
views

Sustainability should be 'default' for companies, most Americans believe
Two-thirds of Americans believe sustainability should be the “default” for companies, according to new research.
The survey of 2,000 general population Americans revealed that 67% believe sustainable products and services should be the standard for companies, not something they need to search for.
And 44% would go so far as to remove unsustainable options from the market entirely — saying companies shouldn’t be able to sell them.
Commissioned by Avocado Green Mattress and conducted by Talker Research, the survey revealed 71% would like to see more regulations in place, to ensure products and services are sustainable.
This may stem, in part, from failed attempts to be sustainable in the past: 32% have purchased something from a company they thought was sustainable, only to find out later that it wasn’t.
Twenty-two percent even admit they’ve “given up” trying to purchase a sustainable product or service because of how difficult it was to find.
Despite the difficulties they might face, the survey found respondents have a desire to be sustainable.
Ten percent said they “always” purchase sustainable options; for those who don’t always do so, 73% said they’d like to do so more frequently.
The expense of sustainable options was the No. 1 thing stopping respondents from purchasing them more often (57%), followed by difficulty in telling what’s actually sustainable (48%).
Respondents also said a lack of availability (30%) stops them from purchasing sustainable options — and others don’t have time to research what is and is not sustainable (26%).
The survey asked respondents if they felt knowledgeable about different sustainability and ethical certifications for products or companies: 9% said they’re “very knowledgeable,” while 29% said “somewhat knowledgeable.”
“Certifications not only protect human health by ensuring quality and safety standards but also protect our environment by verifying sustainable sourcing, manufacturing and business practices,” said Christine Carpio, Sr. Manager, Community + Social Impact. “They can also help guide customers to choose brands dedicated to creating products that are better for people and the planet, ensuring our choices today resonate responsibly tomorrow.”
Half of respondents (51%) were “extremely” or “very” likely to purchase something when it had a certification they were familiar with.
But just the presence of a certification impacts respondents: 22% said even if they’re unfamiliar with the specific certification, seeing it would make them “extremely” or “very” likely to make the purchase.
The survey put Americans’ knowledge of certifications to the test — and found respondents might have more to learn.
When provided several definitions and asked which described “Certified B Corporation,” only 17% of respondents selected the correct answer: A company meets high standards of verified performance, accountability and transparency.
And they were less knowledgeable about “Green America” — only 6% correctly said it means, “A company is committed to using business as a platform for social change.”
On the other hand, 34% were familiar with the “Forest Stewardship Council” certification: selecting the right option, “Products come from responsibly managed forests that provide environmental, social and economic benefits.”
“Greenwashing is a challenge. In reality, most brands don’t have the certifications or environmental credentials to back up their claims,” said Laura Scott, Director of Brand Marketing. “Certifications can help consumers determine whether a brand is trustworthy or if they’re being duped by false advertising.”
Survey methodology:
This random double-opt-in survey of 2,000 general population Americans was commissioned by Avocado Green Mattress between June 20 and June 24, 2024. It was conducted by market research company Talker Research, whose team members are members of the Market Research Society (MRS) and the European Society for Opinion and Marketing Research (ESOMAR).
44
views

Who’s ‘manning’ the grills this summer? Women!
Women are the “unsung hero” of the grill, according to new research, conducted by Talker Research for PERDUE.
The survey of 2,000 men and women revealed that 53% believe women are not receiving the notice or the praise they deserve for their grill skills.
And men and women agree: that stat (53%) remains true regardless of gender.
One reason they might not be getting the recognition they deserve? Research revealed half of the respondents — 55% of men and 47% of women — believe grilling is a male-dominated activity.
96
views
1
comment

How do expecting parents prepare for parenthood?
The average parent will spend more than three weeks of time preparing the nursery for their child before they’re born.
That’s according to a new survey of 1,500 parents with kids under the age of 10 and 500 first-time expecting parents. Results revealed that 28% started decorating their nursery during the second trimester, though 17% dove right in and started as soon as they found out they were pregnant. 20% of respondents waited until the third trimester to start decorating, while 5% did not tackle the task until after the baby was born.
Still, the average parent spent almost seven (6.6) hours tweaking their child’s nursery after they were born.
Almost nine in 10 (86%) chose to know the sex of their baby before they were born. The majority of parents who already have children wanted to know the gender before birth (90%), but first-time expecting parents are less likely to want to know (75%).
Overall, 92% of respondents either have had or will have a baby shower. On their guest lists are family (86%) and friends (79%), along with friends of the grandparents (49%) and coworkers (39%).
Some of the most cherished and appreciated gifts from their baby showers include clothing (59%) and practical items such as bottles, blankets and a diaper bag (58%). A car seat (40%), stroller (37%) and crib (30%) also ranked high.
When it came time for a gender reveal, almost two-thirds of respondents (63%) hosted a party for their family and friends. Of those, the average parent spent almost 12 hours (11.6) planning the party — with some respondents sharing they spent over 31 hours (7%) event planning.
Conducted by Talker Research on behalf of Minted, the survey asked parents to reflect on their experiences associated with pregnancy milestones and reflect on what they’d do differently and what they’d do the same.
When comparing currently expecting parents with more seasoned parents, 42% of first-timers prioritized a gender reveal party, compared to only 23% of those who already have kids under 10.
The first time around, parents prioritized stocking up on all of the physical items they’d need, such as a crib, bottles and swaddling blankets (72%), as well as picking out a name for their child before birth (67%) and knowing their child’s sex before they were born (52%).
Yet, when it comes to a second child, those priorities shift. At the top of the list, parents still want to ensure they have all physical items they need (48%) before the baby's arrival, but creating an archive of memories such as photos, important dates or moments, rose from fifth into second place (34%).
Parents would also spend more time preparing before birth (35%), would like to receive more practical gifts for their child (28%) and would spend more time planning celebrations for their child’s milestones (26%).
Seasoned parents were also asked to reflect on helpful advice they were given when expecting their first child. The top three golden nuggets include sleeping when the baby sleeps (33%), making time for self-care (30%) and trusting your parenting instincts (28%).
Results also found that 45% of parents admit that they are, or will be, less lenient with their second child than they were with their first when it comes to parenting styles, rules and schedules.
This may be because nearly seven in 10 (69%) believe that having a second child helped them “let go” of the less important things in life, and focus more on what’s actually important.
“We know how much time and love parents put into preparing for the arrival of their little one,” said Marissa Cedarleaf, Minted GM of Baby & Kid, Stationery, and Gifts. “We are here to support parents through every step of their journey and share in the celebration of announcing their new baby’s arrival as well as exciting milestones from first birthday through graduation!”
As parents continue to plan milestone celebrations for their kids, the most important parts of planning a birthday party include whether their child is having fun (60%), the food (43%) and the activities and entertainment (40%).
Taking that a step further, another 54% consider the adults attending when party planning and are concerned whether they’re having a good time as well.
“We know how much time and dedication parents put into planning birthday parties,” said Cedarleaf. “Whether it's your first time or you’re an expert, there are countless ways to make it an occasion your child will never forget. The details of each celebration change year to year, but the memories last forever.”
PARENTS' MOST HELPFUL ADVICE TO THOSE EXPECTING THEIR FIRST CHILD
● Sleep when the baby sleeps - 33%
● Make time for self-care - 30%
● Trust your parenting instincts - 28%
● Don’t feel guilty about being an imperfect parent - 28%
● Don’t compare yourself to other parents - 27%
● You don’t have to do everything by yourself - 22%
● Take as many photos and videos as possible so you can look back on them later - 22%
● Be as present as you can - 21%
● Make time to bond with your partner during this new phase in life - 19%
● All of your identify doesn’t have to be tied to being a parent - 12%
Survey methodology:
This random double-opt-in survey of 500 first time expecting parents and 1,500 parents of kids under the age of 10 was commissioned by Minted between May 23 and May 31, 2024. It was conducted by market research company Talker Research, whose team members are members of the Market Research Society (MRS) and the European Society for Opinion and Marketing Research (ESOMAR).
42
views
1
comment

Why do Americans love watching movies with their dogs?
Based on a new study, 43% of Americans would rather watch a movie with their dog than their partner.
According to the poll of 2,000 U.S. dog owners, those in a relationship said their dogs are better movie companions because they don’t interrupt (44%), don’t ask questions (42%) and are better cuddlers (35%).
Commissioned by the makers of ACANA pet food and conducted by Talker Research, the study found that 95% watch movies and shows with their dogs at home — 63% said they do it on a frequent basis.
Most of them (93%) said their dogs are able to pay attention to the screen and a third (30%) say they prefer classic TV shows and classic movies. So, even our furry best friends can’t get enough of the classics.
39
views