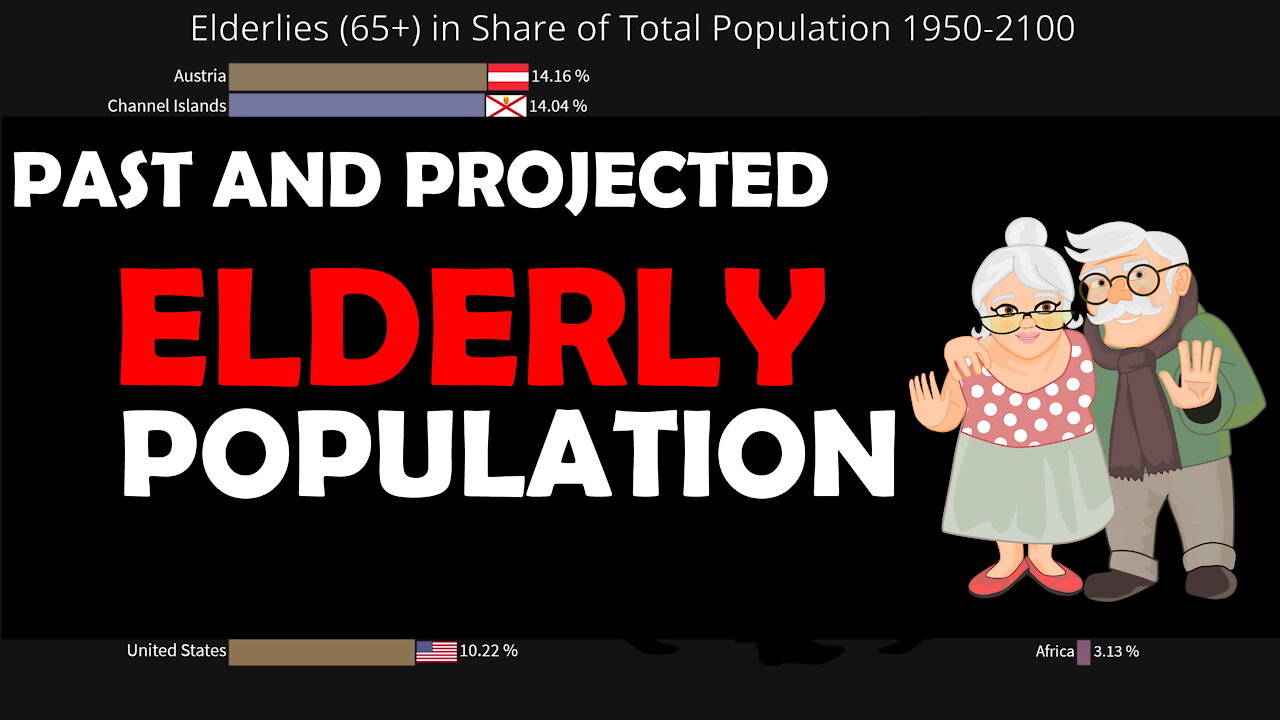
Past and Projected Elderly Population by Country and World
3 years ago
6
This bar chart shows annual elderly population in percentage of the total population, by country, world and world regions. From 1950 to projected 2100 (medium scenario projection).
The growth in share of population is shown as three year running average.
Source:
United Nations, Department of Economic and Social Affairs, World Population Prospects.
Music:
ChickenBeats - Overcloud: https://www.youtube.com/watch?v=v-6IBB45uP0
Music provided by NCS BEST OF: https://youtu.be/Xmq2-foav8U
Special effect by:
AA VFX: https://www.youtube.com/c/dvdangor2011/
Loading comments...
-
 2:59
2:59
WhatDaStat
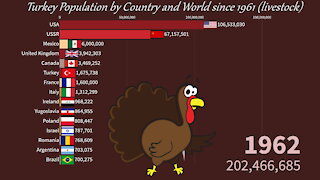
3 years ago🦃 Turkey Population by Country and World since 1961
23 -
 3:46
3:46
WhatDaStat
3 years ago🦆 Duck Population by Country and World since 1961
42 -
 4:00
4:00
WhatDaStat
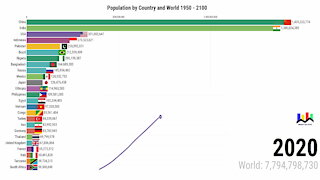
4 years ago $0.02 earnedPopulation by Country and World 1950 - 2100
179 -
 4:42
4:42
WhatDaStat
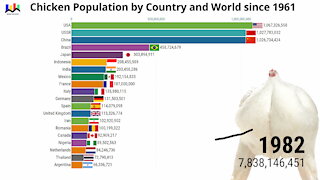
4 years agoChicken Population by Country and World since 1961
108 -
 3:43
3:43
WhatDaStat
4 years agoHorse Population by Country and World since 1961
132 -
 3:38
3:38
Rushsylvania
3 years agoGod's country my World
36 -
 7:45:34
Spartan
8 hours agoPro Halo Player | Halo Infinite Ranked Arena into SWTOR and/or Gears Beta
45.4K -
 5:11:27
This is the Ray Gaming
7 hours ago $1.40 earnedPushing for Rumble Creator Program
39K1 -
 4:09:29
Damysus Gaming
7 hours agoDune: Awakening - Grinding for that Ornithopter - Guild Work! Drown in Some Spice!
23.7K -
 3:42:31
EricJohnPizzaArtist
4 days agoAwesome Sauce PIZZA ART LIVE Ep. #51: Music Night featuring Sophmore John!
30.7K4