Premium Only Content

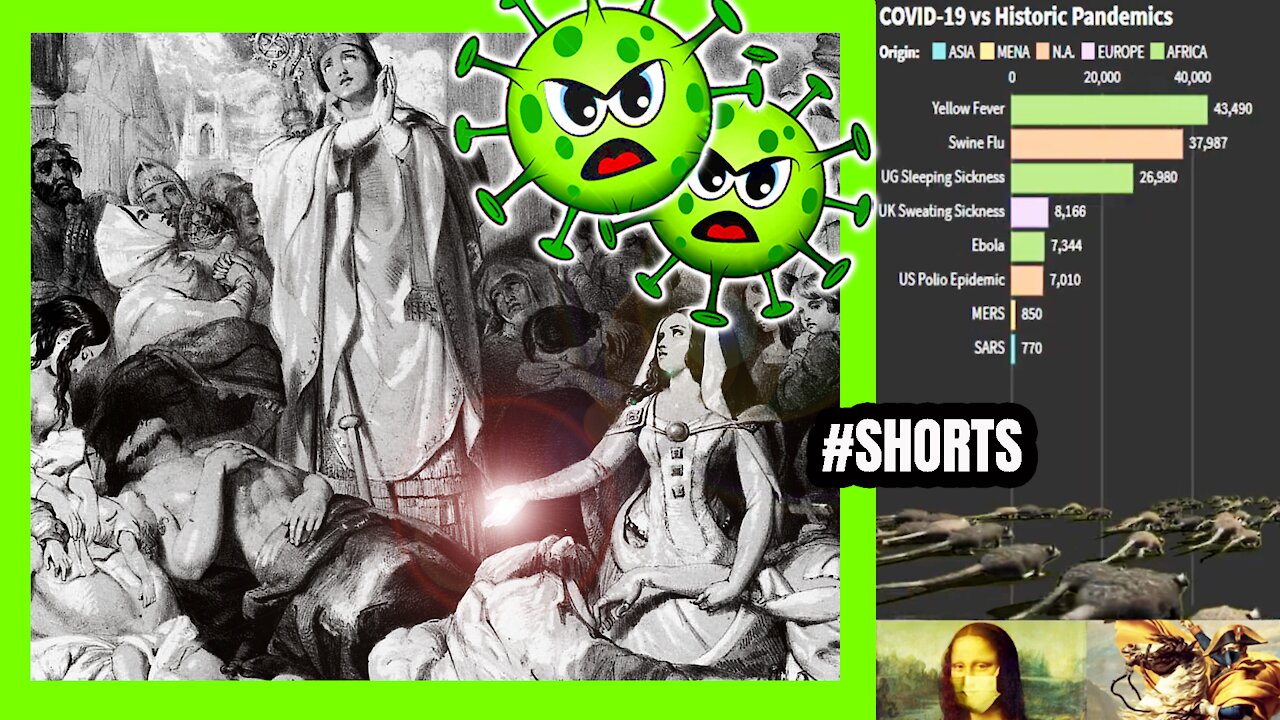
COVID vs Historical Pandemics 😷 📊
This is a #Shorts version of the full version that can be found here:
https://www.youtube.com/watch?v=tgQG4jtyDGQ
This bar chart race ranks the deaths from the largest known epidemics (including pandemics) caused by an infectious disease, from the Antonine Plague to the current COVID-19 event. Widespread non-communicable diseases such as cardiovascular disease and cancer are not included.
An epidemic is the rapid spread of disease to a large number of people in a given population within a short period of time. For example, in meningococcal infections, an attack rate in excess of 15 cases per 100,000 people for two consecutive weeks is considered an epidemic.
Despite the persistence of disease and pandemics throughout history, there’s one consistent trend over time – a gradual reduction in the death rate. Healthcare improvements and understanding the factors that incubate pandemics have been powerful tools in mitigating their impact.
Events that are ongoing, like COVID-19, are estimates as of the date of this published video (Feb, 2021).
Note: Many of the death toll numbers shown in the video are ranges of best estimates based on available research. Some, such as the Plague of Justinian and Swine Flu, are subject to debate based on new evidence.
Data:
https://www.visualcapitalist.com/hist...
https://www.livescience.com/worst-epi...
https://en.wikipedia.org/wiki/List_of...
WHO | https://www.who.int/
CDC | https://www.cdc.gov/
Johns Hopkins | https://coronavirus.jhu.edu/
🎵 Track Info:
Instinct | https://www.bensound.com
#AnimatedStats #COVID #Pandemics #BarChartRace #DataComparison #DataRanking #DataVisualization
-
 3:22
3:22
Data Ninja
3 years agoTop Coffee Export Producers | 1960 - 2021 ☕📊
1023 -
 8:18
8:18
MRCTV
3 years ago'Hamilton' Musical Receives $30M in COVID Bailout - It's Historical American Pork!
2583 -
 0:28
0:28
HANYMata
3 years agoHistorical home garden
40 -
 0:07
0:07
Grandmot
3 years agoHistorical Broom
19 -
 2:08:42
The Dilley Show
6 hours ago $28.05 earnedH1B Visa Debate, Culture and More! w/Author Brenden Dilley 12/26/2024
80.2K22 -
 4:55:59
LumpyPotatoX2
8 hours agoThirsty Thursday on BOX Day - #RumbleGaming
84.3K5 -
 1:04:52
Geeks + Gamers
7 hours agoDisney RATIO'D on Christmas Day | Mufasa Embarrassed By Sonic 3
62.8K4 -
 8:27:46
Sm0k3m
11 hours agoPlaying games on Rumble
38.2K2 -
 10:37
10:37
Russell Brand
2 days agoHow is this even allowed?
186K855 -
 1:37:26
Real Coffee With Scott Adams
8 hours agoEpisode 2701 CWSA 12/26/24
102K91