Animated Waterfall Chart in Tableau
3 years ago
24
This video will help you to build a Animated Waterfall Chart in tableau.
WaterFall Charts are great to anlyse the change in any feature of a datasets.
_______________________________________
★☆★ DATASET LINK: ★☆★
Link ► https://www.kaggle.com/zusmani/pakist...
_______________________________
★☆★ SUBSCRIBE TO ME ON YOUTUBE: ★☆★
Subscribe ► https://www.youtube.com/channel/UCgpF...
_______________________________
★☆★ FOLLOW ME BELOW: ★☆★
Tableau Public ► https://public.tableau.com/profile/sm...
Loading comments...
-
 4:35
4:35
FreshBI
3 years agoPower BI Academy: New Waterfall Chart Features (July 2017)
4 -
 14:50
14:50
Mahogany Lore
6 months agoVisualizing Data for Libraries: Part 3 - Motion Scatter Chart
1 -
 14:47
14:47
humulica
1 year agoIntroduction to Pivot Tables, Charts, and Dashboards
4 -
 1:25
1:25
Mark's Excel Tips
8 months ago10 Tips For Excel Charts Tip # 3 Use a table with a chart
7 -
 2:06
2:06
BossData
1 year agoFrequency of S3x in The World | World Data | Chart Graphic | Data Animation
22 -
 1:06
1:06
Mark's Excel Tips
8 months ago10 Tips For Excel Charts Tip # 4 Quickly filter data from a chart
7 -
 1:57:59
infosectrain01
1 year ago $0.01 earnedWhat is Tableau introduction? | Creating Visualizations in Tableau | Basic Calculations in Tableau
12 -
 14:24
14:24
Exploring the future of technology
11 months agoConnecting Google Analytics 4 to Tableau for Advanced Data Visualization
14 -
 1:41
1:41
Mark's Excel Tips
10 months agoInfographic Timeline Template For Excel
10 -
 1:52
1:52
Mark's Excel Tips
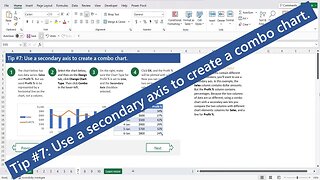
8 months ago10 Tips For Excel Charts Tip # 7 Use a secondary axis to create a combo chart
5