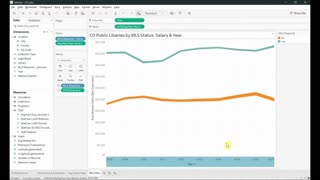
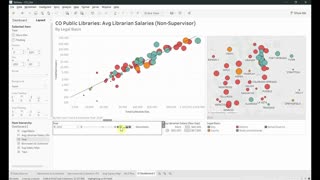
Visualizing Data for Libraries: Part 3 - Motion Scatter Chart
6 months ago
1
Part 3 of the Visualizing Data for Libraries tutorial, created for Rutgers University's Information Visualization term project as part of the MLIS program. This covers how to create a motion scatter chart in Tableau.
Music:
Happy Ukulele by Scott Holmes is licensed under an Attribution-NonCommercial License. Retrieved from http://freemusicarchive.org/music/Scott_Holmes/Happy_Music/Happy_Ukulele_1026
Loading comments...
-
 6:27
6:27
Mahogany Lore
6 months agoVisualizing Data for Libraries: Part 5 - Line Chart
2 -
 15:58
15:58
Mahogany Lore
6 months agoVisualizing Data for Libraries: Part 6 - Dashboard
3 -
 5:05
5:05
lovevol
2 months agoorganization chart software part 1
1 -
 5:05
5:05
lovevol
2 months agoorganization chart software part 2
1 -
 1:36
1:36
MinuteTutor
1 year agoLucidchart (Organize Your Data)
2 -
 44:43
44:43
Microsoft Excel Full Course
3 years agoExcel 365 Part 14 – Chart
92 -
 10:12
10:12
kpmooney
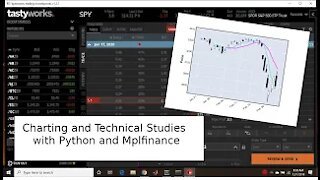
3 years agoCandlestick Charts and Technical Studies Using Python and mplfinance
28 -
 5:13
5:13
Tuts4dummies
11 months agoExcel | VBA | How to Add Chart
291 -
 1:17
1:17
Ascencore
5 months agoStock Chart Technical Analysis With Candlestick Chart Pattern (Explained Using Real Examples)
12 -
 0:58
0:58
Ascencore
6 months agoChart Analysis With The Chande Kroll Stop indicator