Azure Monitor - Metrics Uses and Configuration
So, what can we do with metrics?
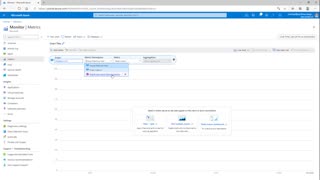
You can use the metrics explorer to analyze metrics on a chart and compare metrics from different resources. You can pin a chart from metrics explorer to an Azure dashboard. You can also create a workbook to combine multiple sets of data in an interactive report. You can export the results of a query to Grafana to leverage dashboarding and combine with other data sources. As we spoke about before, we can use them in alerts. We can create alert rules based on the metrics , send notifications and also call Azure automation then the value of the metric crosses a threshold. Automation is one of the key things that we can do with Metrics. You can increase or decrease the amount of resources based on the threshold that is set for a metric. You can also route metrics to logs to analyze data in Azure Monitor Metrics along with data in Azure Monitor logs. You can also save them for longer periods of time for analysis based on compliance such as HIPPA. The default storage of a metric is 93 days. We can also stream the metrics to an Event Hub to route to external systems. With some of the command line tools we can also retrieve the metrics for further analysis. You could use PowerShell, REST API and also the CLI. For longer periods of time we can archive the information for the performance and health data. This can be used as a baseline that we can compare with the current data to find areas that we need to increase performance. Also, this data can be used for auditing , compliance and offline reporting purposes. We explore this and more in this short video.
-
 5:50
5:50
ideadudes
3 years agoAzure Monitor - Logs / Uses and Configuration
45 -
 6:05
6:05
ideadudes
3 years agoAzure Monitor - Metrics Overview
17 -
 5:56
5:56
ideadudes
3 years agoAzure Monitor Basics
119 -
 20:26
20:26
dwtwo
3 years agoMonitor repair
81 -
 1:51
1:51
flopearedmule
3 years agoMonitor style steam engine
96 -
 9:04
9:04
JowersTechnologySolutions
3 years agoUbiquiti AP Configuration
21 -
 0:08
0:08
Hole in the Ground Productions
3 years agoHungry Computer Monitor
1031 -
 0:25
0:25
ViralHog
3 years agoMonitor Lizard Lays on Motor
2992 -
 6:37
6:37
scoutthedoggie
1 day agoNovritsch SSX23 Pistol In Action - Scotland
37.6K6 -
 11:47
11:47
ParisDemers
20 hours agoTrain Like DareDevil To Get Jacked FAST And Gain Enhanced Senses!
41.5K17