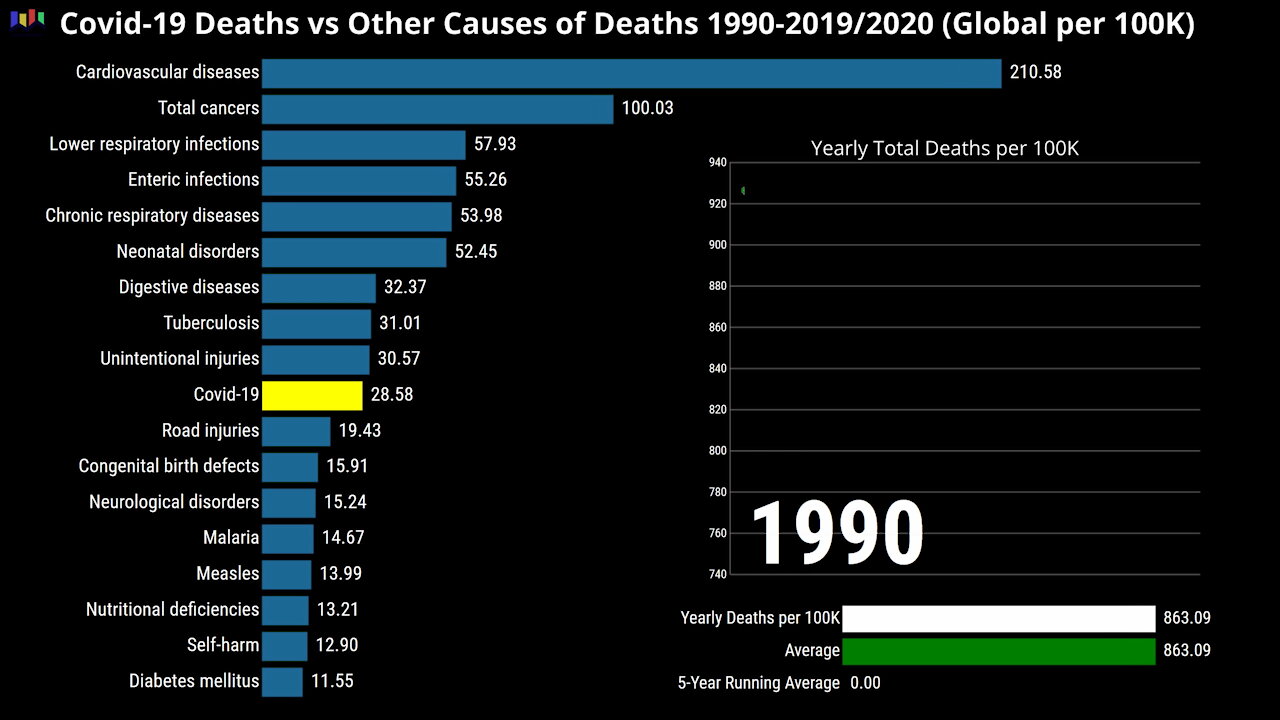
Covid-19 Deaths vs Other Causes 1990-2019/2020 Global
This bar chart race compares Covid-19 deaths per 100.000 to other causes of deaths from 1990 to 2019. The second graph shows the total yearly deaths, total average per year and the 5-year running average, from 1990-2020.
The Covid-19 deaths per 100K is converted into a yearly number, from the first day of confirmed deaths to 9th April 2021.
Note that the total deaths in 2020 is not final for all countries. So here it is projected deaths vs worst case scenario (worst case: assuming none of the Covid-19 deaths would occur as other causes of deaths that year). In reality, the number is not the worst case assumption, but somewhere between when isolation from other anomalies that may have occured in 2020.
Other major pandemics and epidemics are not included here (see earlier videos).
Sources:
Global Burden of Disease Collaborative Network, Global Burden of Disease Study 2019 (GBD 2019) Results, Seattle, United States: Institute for Health Metrics and Evaluation (IHME), 2020.
European Centre for Disease Prevention and Control (ECDC) and John Hopkins University (CSSE)
Music:
Endurance by Scott Buckley – www.scottbuckley.com.au
-
 1:09
1:09
KERO
4 years agoCOVID-19 One Year Later - Demographics of deaths and underlying causes
18 -
 1:43
1:43
Reuters
4 years agoGlobal COVID-19 death toll surpasses 3 million
6708 -
 1:37
1:37
Reuters
4 years agoBrazil hits record COVID-19 deaths
3555 -
 0:24
0:24
Newsy
4 years agoU.S. Averaging Fewer COVID-19 Deaths
5775 -
 5:22
5:22
NEWSMAX
4 years agoOne-Year Since W.H.O Declared Covid-19 a Global Pandemic
5487 -
 4:56
4:56
davidjayjackson
4 years agoCOVID-19: NPR, 300,000 Deaths by Dec. 1, 2020
45 -
 0:34
0:34
KTNV
4 years ago63 new COVID-19 deaths reported Saturday
3243 -
 1:33
1:33
AfricanNewsAgency
4 years agoSeven provinces in SA record zero Covid-19 deaths
32 -
 1:32
1:32
rockandroll
4 years ago $0.21 earnedDr. Birx Covid-19 Deaths
2.96K1 -
 2:36:38
Badlands Media
1 day agoThe Narrative Ep. 25: Kayfabian Chaos
92.7K32