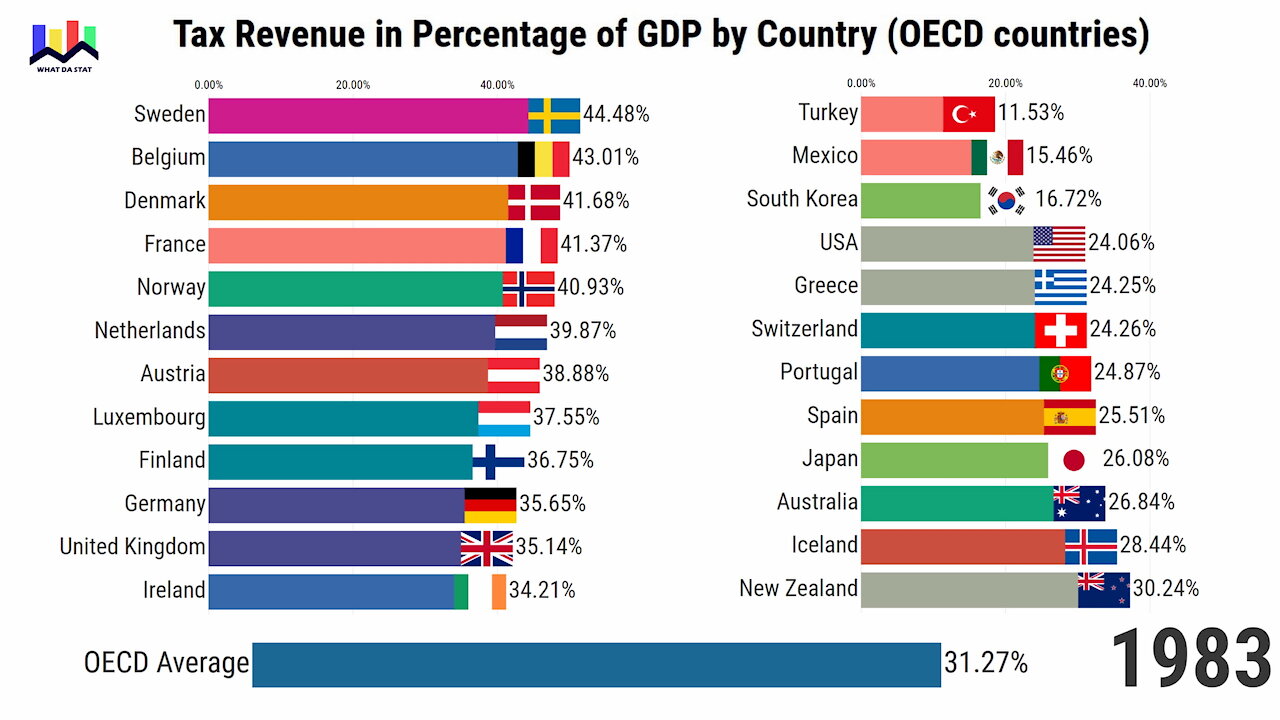
Tax Revenue in Percentage of GDP by Country (OECD) since 1965
How much of governments income are gained through taxation?
This bar chart race shows tax revenue in percentage compared to OECD countries respective GDP, 1965-2018, highest and lowest.
Definition of Tax revenue (OECD):
Tax revenue is defined as the revenues collected from taxes on income and profits, social security contributions, taxes levied on goods and services, payroll taxes, taxes on the ownership and transfer of property, and other taxes. Total tax revenue as a percentage of GDP indicates the share of a country's output that is collected by the government through taxes. It can be regarded as one measure of the degree to which the government controls the economy's resources. The tax burden is measured by taking the total tax revenues received as a percentage of GDP. This indicator relates to government as a whole (all government levels) and is measured in million USD and percentage of GDP.
OECD member states:
Countries appear in this video when they become member states. Following countries are members:
1961: Canada, USA, United Kingdom, Denmark, Iceland, Norway, Turkey, Spain, Portugal, France, Ireland, Belgium, Germany, Greece, Sweden, Switzerland, Austria, Netherlands, Luxembourg.
Later: Italy (1962), Japan (1964), Finland (1969), Australia (1971), New Zealand (1973), Mexico (1994), Czech Republic (1995), Hungary (1996), Poland (1996), South Korea (1996), Slovakia (2000), Chile (2010), Slovenia (2010), Israel (2010), Estonia (2010), Latvia (2016), Lithuania (2018), Colombia (2018).
Source: OECD
Music:
Markvard - https://soundcloud.com/markvard/markvard-take-a-chance
Markvard - Happy [NCS BEST OF]: https://youtu.be/-K0aUPMocro
-
 3:05
3:05
WhatDaStat
4 years agoNuclear Electricity Generated per Capita by Country and World since 1965
95 -
 4:42
4:42
WhatDaStat
4 years agoChicken Population by Country and World since 1961
108 -
 2:29
2:29
WhatDaStat
4 years agoFixed Telephone Subscriptions by Country since 1960
373 -
 3:43
3:43
WhatDaStat
4 years agoHorse Population by Country and World since 1961
132 -
 3:09
3:09
WhatDaStat
4 years agoSex Ratio at Birth by Country since 1950
84 -
 0:11
0:11
the oddity and woners of animals
4 years ago $0.01 earneda country hors
6581 -
 2:43
2:43
JSCAMERON
4 years agoCOUNTRY DREAM'S
90 -
 4:48
4:48
I’m just a singer, a natural born guitar ringer.
4 years ago $0.20 earnedCountry Blues
72111 -
 2:38
2:38
pottmoss
4 years ago $0.02 earnedWaimanalo Country Farms
103 -
 54:47
54:47
Side Scrollers Podcast
18 hours agoSide Scroller Presents KING OF THE KART | MASSIVE MARIO KART TOURNAMENT
53.1K1