

Statistics Help: The percentage of 46+ age group is - Frequency, Relative Frequency, Percentage
saxi753
#Percentage
#RelativeFrequency
#Frenquency
#StatisticsHelp
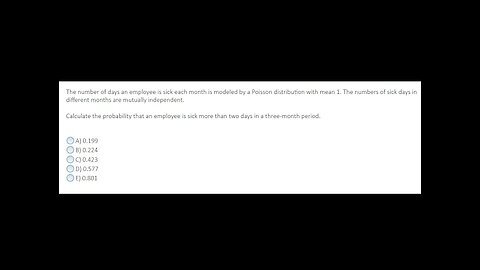
The number of days an employee is sick each month is modeled by a Poisson distribution with mean 1.
saxi753
The number of days an employee is sick each month is modeled by a Poisson distribution with mean 1.
#Probability
#Statistics
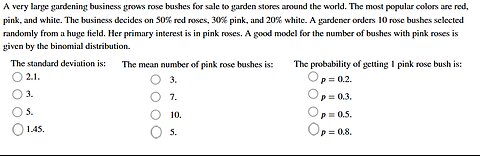
Statistics Help: A very large gardening business grows rose bushes for sale to garden stores around
saxi753
A very large gardening business grows rose bushes for sale to garden stores around the world. The most popular colors are red, pink, and white. The business decides on 50% red roses, 30% pink, and 20% white. A gardener orders 10 rose bushes selected randomly from a huge field. Her primary interest is in pink roses. A good model for the number of bushes with pink roses is given by the binomial distribution.
#StatisticsHelp
#Techniques
#BinominalDistribution
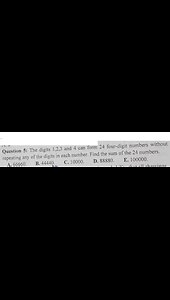
The digits 1,2,3 and 4 can form 24 four-digit numbers without repeating any of the digits in each
saxi753
The digits 1,2,3 and 4 can form 24 four-digit numbers without repeating any of the digits in each number. Find the sum of 24 numbers
#Digits
#Arrangements
#Statistics

Probability Help: Draw the tree diagram for rolling a 6-sided die,then flipping a coin.Add P at end
saxi753
Here is the technique to solve this question and how to find them in step-by-step
#ProbabilityHelp
#TreeDiagram
#Techniques
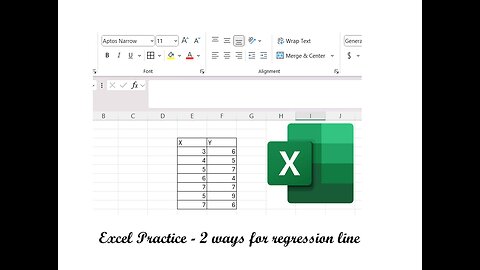
Excel: Two ways to make Regression Line on Microsoft Excel - Step-by-step
saxi753
Here is the technique to solve the question related to regression line and how to find them in step-by-step
#RegressionLine
#MicrosoftExcel
#Excel
#Table
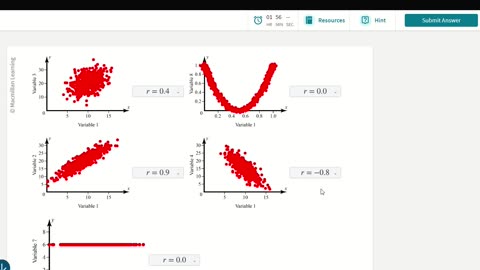
Statistics Help: Each of the following graphs show the relationship between two variables
saxi753
Each of the following graphs show the relationship between two variables. Determine the Pearson product-moment correlation coefficient (r) for each graph.
#StatisticsHelp
#Variables
#Correlationship
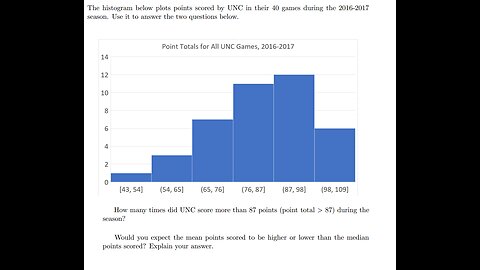
Statistics Help: The Histogram below plots points scored by UNC in their 40 games during 2016-2017
saxi753
Here is the technique to solve the question related to Histogram and Statistics
#Histogram
#Statistics
#Techniques
#Distribution
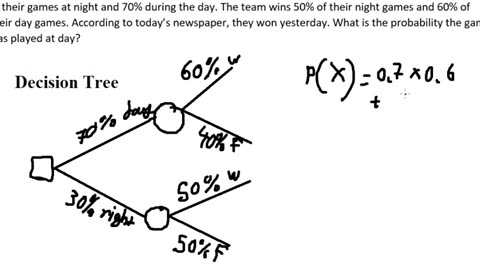
Statistics Help: The Ludlow Wildcats baseball team, a minor league team in the Cleveland Indians
saxi753
Here is the full video how to solve the statistics by tree diagram with step-by-step
#TreeDiagram
#Statistics
#Techniques

Statistics Help: How to draw the basic Scatter chart for Analysis - Excel Practice
saxi753
Here is the basic techniques to solve how to solve the question related to Scatter chart.
#Excel
#Scatter
#Chart
#Statistics
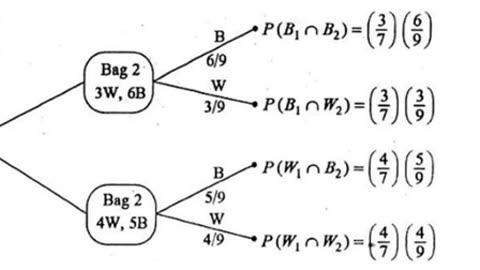
One bag contains 4 white balls and 3 black balls, and a second bag contains 3 white balls and 5black
saxi753
Question: One bag contains 4 white balls and 3 black balls, and a second bag contains 3 white balls and 5
black balls. One ball is drawn from the first bag and placed unseen in the second bag. What is the
probability that a ball now drawn from the second bag is black?
#Probability
#Statistics
#Technique
#Formula

Sta Pro The table summarizes results from pedestrian deaths that were caused by automobile accidents
saxi753
Here is the answer of Statistics:
Here is the full question:
The following data summarizes results from 985 pedestrian deaths that were caused by accidents.
If one of the pedestrian deaths is randomly selected, find the probability that the pedestrian was intoxicated or the driver was intoxicated.
If one of the pedestrian deaths is randomly selected, find the probability that neither the pedestrian nor the driver was intoxicated.
If one of the pedestrian deaths is randomly selected, find the probability that the pedestrian was intoxicated
#Probability
#Techniques
#Solutions
#Answer
#Formula
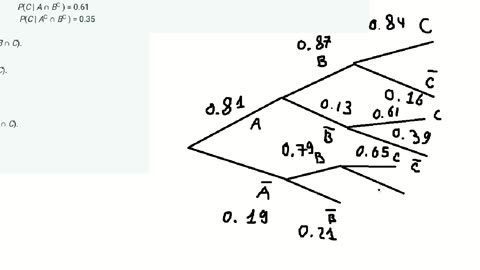
Statistics Help: For customers purchasing a refrigerator at a certain appliance store, let A be the
saxi753
For customers purchasing a refrigerator at a certain appliance store, let A be the event that the refrigerator was manufactured in the U.S., B be the event that the refrigerator had an icemaker, and C be the event that the customer purchased an extended warranty.
Statistics Help: The Ludlow Wildcats baseball team, a minor league team in the Cleveland Indians
Loading comments...
-
 24:02
24:02
Kimberly Guilfoyle
4 hours agoCartel Strikes: Breaking News Coverage! | Ep.251
22.1K8 -
 1:01:36
Sarah Westall
2 hours agoBlackrock & the WEF Collaborate for World Dominance, Free Agency with AI w/ Reinette Senum
17.7K1 -
 3:08
3:08
Michael Heaver
13 hours agoOutraged UK Sends EMPHATIC Message
7.94K3 -
 1:20:15
vivafrei
4 hours agoRFK Jr. Takes on the Pharma WHOORES! Toddler-Assaulter Granted BAIL? COMPLYE WITH CRIMINALS! & more
108K61 -
 LIVE
LIVE
LadyDesireeMusic
3 hours ago $1.25 earnedLive Piano Request - Anti Brain Rot - Support Culture Shift
130 watching -
 LIVE
LIVE
LFA TV
11 hours agoLFA TV ALL DAY STREAM - THURSDAY 9/4/25
1,001 watching -
 13:43
13:43
The Kevin Trudeau Show Limitless
1 day agoClassified File 3 | Kevin Trudeau EXPOSES Secret Society Brainwave Training
79.3K11 -
 1:09:23
The HotSeat
3 hours agoTrump’s Parade = Mocked, China’s Parade = Praised: Leftist Hypocrisy EXPOSED
20K6 -
 1:57:29
The Quartering
5 hours agoRFK Jr Goes NUCLEAR, Horrible Tomb Raider News, Anti-White Male Propaganda
100K38 -
 LIVE
LIVE
Dr Disrespect
7 hours ago🔴LIVE: Hell Is Us Launch - DR DISRESPECT’s First Look at the Scariest Game of 2025!
954 watching