Excel | VBA | How to Add Chart
10 months ago
283
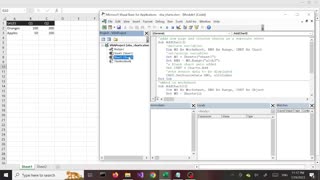
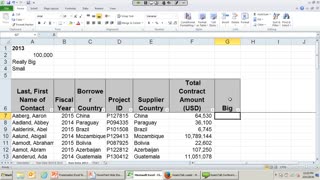
Excel | VBA | How To Add Charts | Part 1
This short 5 mins tutorials demonstrates how to add a chart to excel workbook with a few lines of VBA code.
#MicrosoftExcel
#ExcelCharts
#ChartsInExcel
#ExcelTutorial
#vbaTutorial
#VisualBasicForApplications
Learn_
Check Out Part 2 for more:
https://youtu.be/ByuOdBVi3zM
follow on twitter @tuts4dummies
Loading comments...
-
 4:54
4:54
Tuts4dummies
10 months agoExcel | VBA | How to add chart | part 2
10 -
 6:45
6:45
Tuts4dummies
10 months agoExcel | VBA | How To Add, Embed Charts | Part 3
9 -
 12:10
12:10
Kaceli TechTraining
10 months agoHow to Use Excel for the Absolute Beginner
4 -
 8:13
8:13
Subjectmoney.com
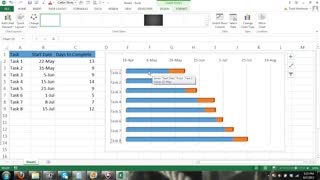
3 years agoMicrosoft Excel Gantt Chart Tutorial - How to Create a Gantt Chart w/Excel 2013 Bar Chart
80 -
 6:44
6:44
Subjectmoney.com
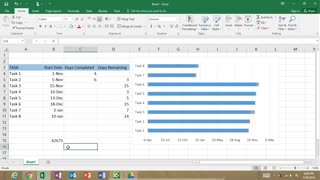
3 years agoGantt Chart Excel Tutorial How to Make a Gantt Chart in Excel
19 -
 1:31:08
Kcc23
3 years ago $0.01 earnedExcel for Beginners
35 -
 8:46
8:46
ddand726
2 years agoVisual Basic Scripting Tutorial 13 connect script to excel
56 -
 44:08
44:08
Excel For Freelancers
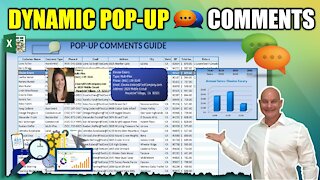
3 years ago $0.02 earnedHow To Create 4 Different Dynamic Pop-up Comments In Excel Including A Chart
105 -
 36:15
36:15
Subjectmoney.com
3 years agoMicrosoft Excel 2016 Tutorial For Beginners Part 2 Full Intro
155 -
 44:43
44:43
Microsoft Excel Full Course
3 years agoExcel 365 Part 14 – Chart
92