Excel Charts: Total Values for Stacked Charts in Excel
Apr 28, 2017 Excel Charts
Download the workbook here: http://bit.ly/2pnDt5F
Learn how to add total values to stacked charts in Excel.
Stacked charts are great for when you want to compare different categories with one another and also show how much each category contributes to the whole.
The problem is that you can show the data labels for each of the stacks, but you cannot immediately show the total value of all the stacks on top of each bar. To do this, you need to follow the steps I show in the video.
★ My Online Excel Courses ► https://courses.xelplus.com/
✉ Subscribe & get my TOP 10 Excel formulas e-book for free
https://www.xelplus.com/free-ebook/
EXCEL RESOURCES I Recommend: https://www.xelplus.com/resources/
Get Office 365: https://microsoft.msafflnk.net/15OEg
Microsoft Surface: https://microsoft.msafflnk.net/c/1327040/451518/7593
GEAR
Camera: https://amzn.to/2FLiFho
Screen recorder: http://techsmith.pxf.io/c/1252781/347799/5161
Microphone: https://amzn.to/2DVKstA
Lights: http://amzn.to/2eJKg1U
Note: This description contains affiliate links, which means at no additional cost to you, we will receive a small commission if you make a purchase using the links. This helps support the channel and allows us to continue to make videos like this. Thank you for your support!
#MsExcel
-
 3:07
3:07
Excelliott Technology
2 years agoExcel - Conditional Formatting on Duplicate Values
2 -
 1:41
1:41
PorcunaByte
3 years agoMicrosoft Excel - Charts
1 -
 2:40
2:40
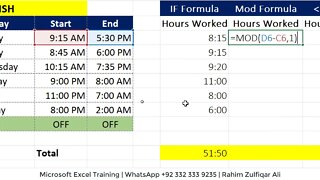
RahimZulfiqarAli
2 years agoCalculating Total Working Hours using Excel - 3 Solutions
-
 LIVE
LIVE
Nerdrotic
1 hour agoNerdrotic At Night 531
413 watching -
 LIVE
LIVE
TheCrucible
1 hour agoWATCH PARTY! Coach Greg Adams vs Andrew Wilson: Marriage in the West is Good For Men (11/03/25)
1,415 watching -
 LIVE
LIVE
The Jimmy Dore Show
2 hours agoTrump Threatens to INVADE Nigeria! Kash Patel CRASHES OUT Over Jet Use Criticism!
5,545 watching -
 LIVE
LIVE
Conductor_Jackson
21 hours agoLet's Play Unrailed 2 Solo! 🚂🚂🚂🚂🚂🚂
6 watching -
 1:25:38
Kim Iversen
3 hours agoTrump’s Nigeria Threat Isn’t About Christians — It’s About China
76K68 -
 LIVE
LIVE
VikingNilsen
6 hours ago🔴LIVE - ARC RAIDERS - QUEST GRINDING
11 watching -
 59:10
59:10
Sean Unpaved
2 hours agoDodgers Dynasty Rolls On, NFL Chaos Reigns, & MNF Showdown Countdown
13.1K1