Section 4 : How to create effective and appealing consumer report pt 15
1 year ago
1
As part of my learning's business series from @ZeroToMastery
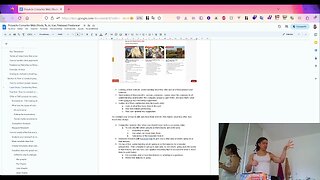
Recap Charts to used in a report :
- Bar graphs
- Pie charts
- Line graph
- Area charts
- Scatter plot
- Bubble chart
- Heatmap
- Waterfall chart
- Data tables
- Pictograms
Source: https://www.linkedin.com/company/datahero/
Course :💼 https://zerotomastery.io/courses/learn-freelance-consulting
Loading comments...
-
 50:01
50:01
Eulier101
1 year agoSection 4 : How to create effective and appealing consumer report pt 16
1 -
 46:54
46:54
Eulier101
1 year agoSection 4 : How to create effective and appealing consumer report pt 18
3 -
 7:09
7:09
Pharos Technology
10 months agoCreating Reports using the Report Wizard in Microsoft Access
5 -
 2:16
2:16
AHMEDKAZEKA97
2 years agoThe Ultimate Guide to Data Analysis in Excel and Google Sheets
43 -
 8:59
8:59
Pharos Technology
9 months agoVBA Techniques for Advanced Report Customization
6 -
 1:11
1:11
kramatnumiko7
1 year agoWriting Business Reports
7.09K -
 4:08:07
WorldAcademicTutor
11 months ago7/08/2023 Principles of Marketing: Chapter 1- Creating and Capturing Value
16 -
 5:17
5:17
Excel Plus Studio
1 year agoUSE QUICK ANALYSIS TOOL TO ANALYZE LIKE A CHAMP IN EXCEL
23 -
 3:18
3:18
Inbound Marketing Tutorials
8 months agoTarget Audience for an Analyst Report During the Decision Stage of the Buyer’s Journey
1 -
 1:02
1:02
Rafferty Pendery
7 months agoSales Fundamentals - Belief in Product or Service - Part 2 - Understand the Impact: