Market Profile Defining Static Areas of Interest and Confluence Session III
#daytrading #orderflow #marketprofile
Daily Prep Workspace (Action Plan) Market Profile
Market Profile charts are different in construction and essentially display almost identical to VbP. The operative word here is almost. Market Profile theory uses time as a standard with an attempt to define the POC based on the amount of time spent at a certain price. The MP POC can vary from VbP POC, sometimes by a substantial distance. Understand this variance, if you spend a lot of time at a certain price does not mean there was a lot of volume, The most thorough view is to display a VbP Study with the Market Profile. The LVN areas on the VbP study make excellent areas to watch for a retrace on a Market Profile chart as displayed below.
Daily Preparation: The Practical application of the Volume Profile and Market Profile Charts
We do not know where the market will move. Up or down, driven by news, tweets, a catastrophic weather event or even perhaps political unrest. Planning your trading day stabilizes what is an otherwise chaotic environment. The two charts I have laid out for planning do not predict where the market will go, I do not predict direction. I lay out areas on charts based on (1) LVNs (2) POCs and last HVNs in that order. The greatest attention being paid to LVNs and POCs in that order.
Morning Prep:
Review and mark-up 15 Min VbP chart
Before the open review 15 Min VbP chart and insert a horizontal line at a LVN from the consolidated VbP display on the right. Review chart bars to the left looking for correlation of that LVN line to any significant chart event. What to look for is the art of trading and only by doing this every day, never fail, no exceptions will your selection skill improve. What are you looking for?
I. LVN in a space where price action broke above or below a consolidation area
II. LVN correlates to the LVN of 15 Min VbP
III. Mark larger areas of lower volume troughs being careful to examine chart action that caused this occurrence
IV. Have lines transferred to other working charts
Review and mark-up Market Profile Cont.
Since the LVN Lines noted on the previous chart are automatically displayed on the Market Profile chart we can get a good visual of what happened in that space by time (Remember Market Profile theory is based on Time not Volume).
1. Make note of any areas of confluence
a. Are there any LVNs specifically through single print areas of the Market Profile?
b. Are any LVN lines closely correlated to the Market Profile POC?
c. Since there is a daily Volume Profile displayed with the Market Profile make note of previous VPOC (Volume Point of Control) above and below the current trading day. These (Naked, Open, Virgin) POCs often represent points of change.
2. Highlight the areas you feel have a high correlation between both charts.
Our study of previous market conditions is complete. This body of work has prepared our workspace to:
I. Identify work zones that represent the greatest chance of change. LVNs and VPOCs
II. Identify areas of HVNs that represent challenging trading conditions
Now you have seen how my screens look when my daily prep is completed. I have included notes in the chart for educational purpose only, they are not part of my regular prep. I have included a glossary of terms and acronyms last so you can print an individual page to better grasp this section.
-
 1:02:19
ThePit
1 year agoVolume by Price - Defining Static Areas of Interest - Session II
9 -
 34:19
34:19
TheFreedomChasersPodcast
1 year agoHow to Leverage Relationships and Systems To Grow Your Real Estate Business With Eli Goodman
18 -
 4:55
4:55
Ten Ton Online
3 years ago3 Questions To Help Determine Your Business's Target Audience @TenTonOnline
41 -
 14:21
14:21
Korbs
3 years agoVolume Profile vs Market Profile Explained!
53 -
 5:39
5:39
Ten Ton Online
3 years agoFind Your Target Market - Clear, Simple Steps @TenTonOnline
36 -
 3:59
3:59
Muathe.com
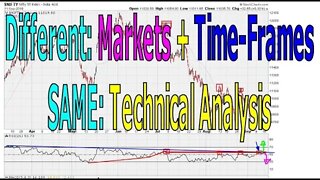
4 years agoDifferent Markets, Different Time Frames SAME Technicals - #1036
4 -
 30:30
30:30
Making Bank
1 year agoThe Art Of Negotiations: Mastering Sales Psychology For Success #MakingBank #S7E51
44 -
 5:40
5:40
MicrosTrader: Learn to Scalp ES NQ Futures
9 months agoFriday Wrap Up | How Did We Do??? | Price Action +Technical Analysis + Market Profile + ICT
16 -
 9:11
9:11
TheLAProbateExpert
1 year agoRedfin Tries To Talk Investors Out of the Real Estate Market, But Its Not Working!
9 -
 20:15
20:15
Real Estate Agent Tips with Josh
10 months agoRealtors Talking with Sellers - TRR, Conditions, Clouds, Repair Walkthrough - Pt 7 of 8
13