S&P 500 Technical Analysis: Head And Shoulders Chart Pattern Forming
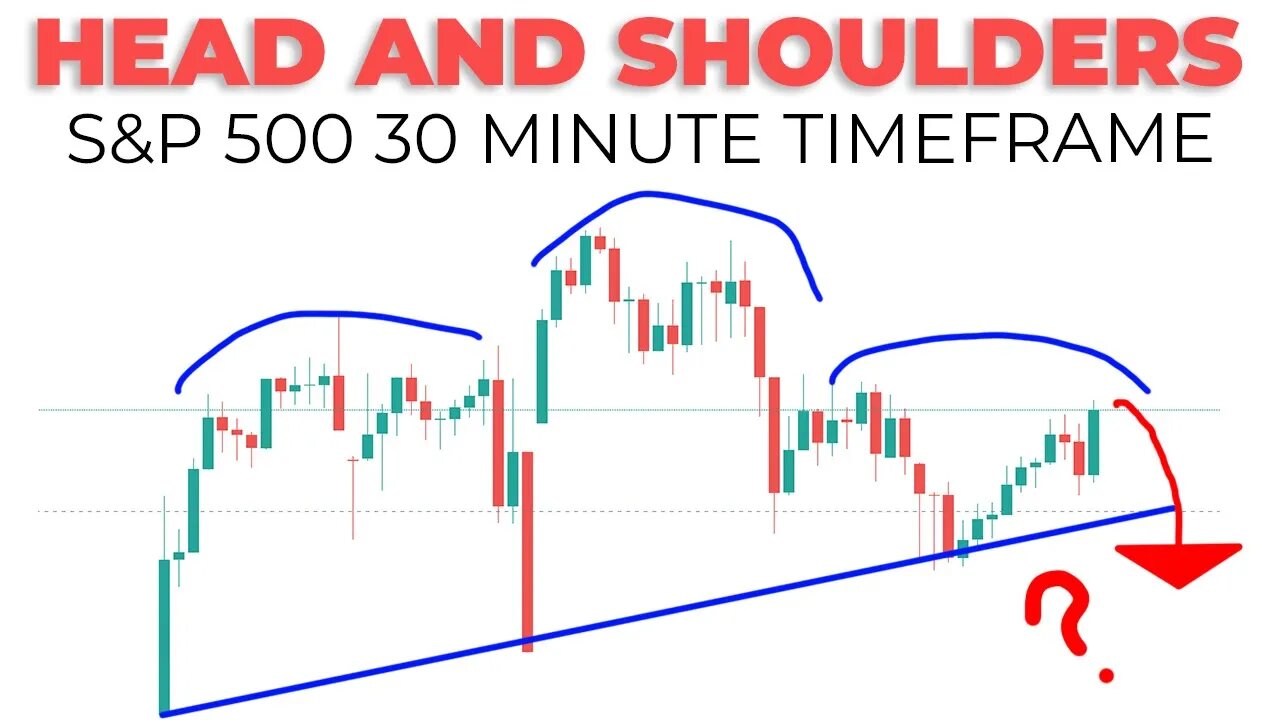
In today's S&P 500 Technical analysis I discuss the head and shoulders chart pattern forming on the 30 minute time frame. First I will go over the weekly timeframe , then daily, and then the 30 minute timeframe where this pattern is forming.
Head and shoulders patterns are typically bearish once the neck line is broken. Keep an eye on the s500 for a potential crash through the neck line when the market opens after memorial day weekend.
★ GET 2 FREE STOCKS by using Webull: https://bit.ly/37wobNT
★☆★ Subscribe★☆★
https://bit.ly/2SfhnxO
Connect With Me:
Instagram ▶️: https://www.instagram.com/figuringoutmoney
Twitter ▶️: https://twitter.com/mikepsilva
#SP500 #TechnicalAnalysis
DISCLOSURE: I am not a professional investment advisor, nor do I claim to be. All my videos are for entertainment and educational purposes only
-
 11:07
11:07
Figuring Out Money
2 years ago $0.01 earnedGet A Closer Look At This Stock Market Rally!
82 -
 LIVE
LIVE
Midnight In The Mountains™
3 hours agoThe Midnights Play Arc Raiders | Loot Scoot and KILL | Crypto Wallet up n running GO JOIN THE BETA!
133 watching -
 53:25
53:25
X22 Report
4 hours agoMr & Mrs X - Trump Is Using The Same Tactic As Our Founding Fathers To Rebuild America - EP 17
66.9K16 -
 LIVE
LIVE
PudgeTV
1 hour ago🟣 Arc Raiders - Gaming on Rumble | Going Topside w My Daughter’s Husband
71 watching -
 2:05:43
LFA TV
20 hours agoRUMBLE RUNDOWN WEEK 7 with SHAWN FARASH 11.22.25 9AM
130K7 -
 LIVE
LIVE
ttvglamourx
1 hour ago $0.60 earnedGLAMOURX VS CALL OF DUTY LOBBIES !DISCORD
182 watching -
 LIVE
LIVE
DannyStreams
4 hours agoSaturday Morning Tarky
73 watching -
 1:12:53
Wendy Bell Radio
7 hours agoPet Talk With The Pet Doc
26.4K20 -
 LIVE
LIVE
CHiLi XDD
1 hour agoFF7 Remake | Materia Hunting at its finest!
70 watching -
 33:49
33:49
SouthernbelleReacts
20 hours ago $1.43 earnedNOT THE GOPHER 😭🤣 | First Time Watching Caddyshack
13.4K2