SP500 Daily Stock Market Forecast (Symmetrical Triangle Coiling Up) | S&P 500 Technical Analysis
In today's Sp500 Daily Stock Market Forecast, we look at the S&P 500 using technical analysis.
The way I determine where price action moves is through support, resistance and candlestick patterns. By looking at these certain levels it helps with predicting where the stock market might head going into the next day / week / month.
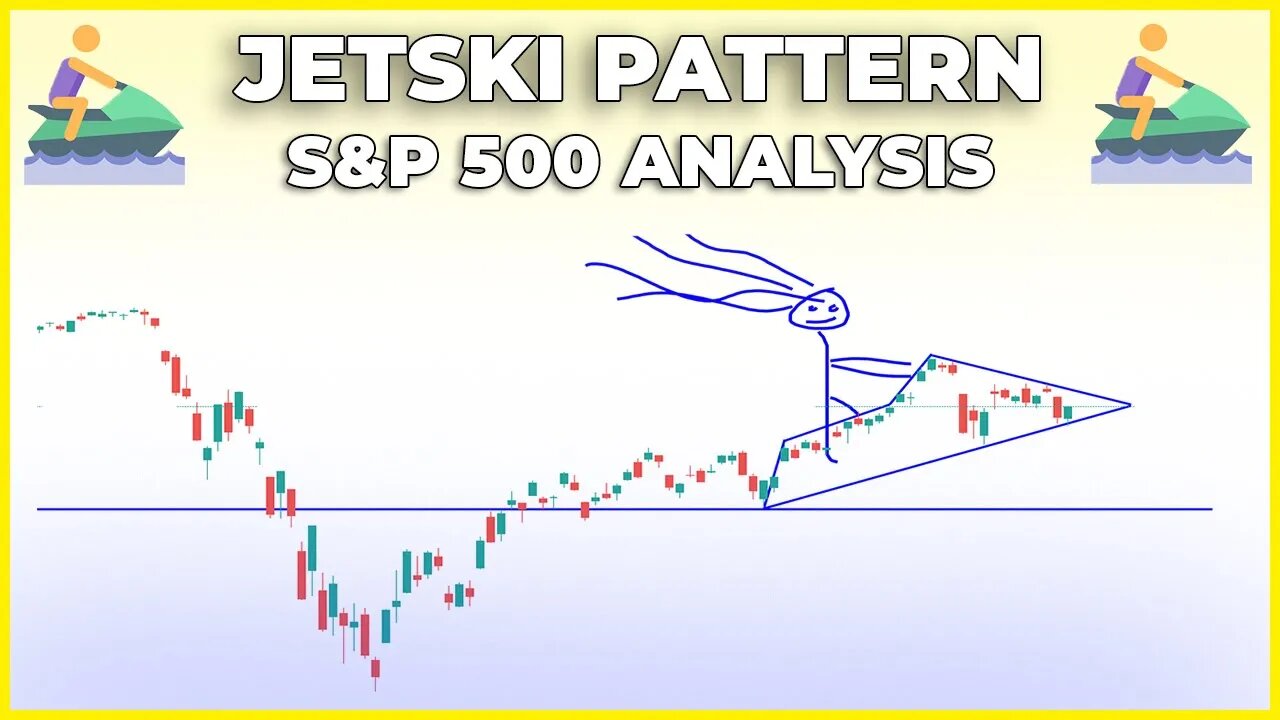
The current pattern that is forming is known as a Symmetrical Triangle, Typically what you see is a fight between the bulls and the bears until it gets so tightly coiled up it explodes in a certain way. The overall context of the chart is bullish, so I think its a safe bet knowing we might see a run up tomorrow in the stock market
However, anything that can happen will happen in the stock market. make sure to manage your risk like a pro trader.
TIMESTAMPS:
Intro: 00:00
SP500 Daily: 00:27
SP500 30 Min: 02:23
Jet Ski Pattern: 05:26
Coco is sad: 07:30
MY FAVORITES - https://amz.run/3JLv
○ Book Recommendations
○ My Studio Setup
○ Morning Coffee
STOCK TRADING PLATFORM
○ Webull (GET 2 FREE STOCKS): https://bit.ly/37wobNT
COME SAY HI:
Instagram: https://www.instagram.com/figuringoutmoney
Twitter: https://twitter.com/mikepsilva
Make sure to SUBSCRIBE to my channel!
DISCLAIMER: I am not a professional investment advisor, nor do I claim to be. All my videos are for entertainment and educational purposes only. This is not trading advice. I am wrong all the time. Everything you watch on my channel is my opinion. Links included in this description might be affiliate links. If you purchase a product or service with the links that I provide I may receive a small commission. There is no additional charge to you! Thank you for supporting my channel :)
#SP500 #StockMarket #TechnicaAnalysis
-
 7:24
7:24
Figuring Out Money
1 year agoMomentum Slowing, Divergences Growing: What Does This Mean For The Markets?
48 -
 25:56
25:56
DeVory Darkins
18 hours ago $0.27 earnedTrump drops ULTIMATE BOMB on Democrat Mayors as ICE makes SHOCKING Announcement
17.9K119 -
 LIVE
LIVE
TonYGaMinG
3 hours ago🟢 ABI WITH FRIENDS | 🍩JOE DONUTS | 😶 🌫 VLADSGAMINGCARTEL |
73 watching -
 21:24
21:24
marcushouse
9 hours ago $0.06 earnedStarship Flight 10: Go or No? 🚀
8.66K9 -
 LIVE
LIVE
MrR4ger
14 hours agoSUNDAY FUNDAY w/ R4GER - VARIETY / DIABLO 4/ FOR HONOR / ETC?
91 watching -
 5:40
5:40
WhaddoYouMeme
3 days ago $0.16 earnedThey’re Calling This the End of Masculinity
11.4K13 -
 15:24
15:24
Tactical Advisor
18 hours agoBest 2011 of 2025 | Bul Armory Ultralight Pro
13.7K -
 27:31
27:31
True Crime | Unsolved Cases | Mysterious Stories
2 days ago $0.09 earnedThe Hong Kong Schoolgirl Mystery – 5 Mysterious Unsolved Cases (Part 8)
11.8K2 -
 7:19
7:19
China Uncensored
1 day agoChina is DONE in the South China Sea
10.8K26 -
 LIVE
LIVE
Joe Donuts Live
5 hours ago🟢 Loot Rats Unleashed: Arena Breakout Chaos! | Joe + Tony + Vlad
224 watching