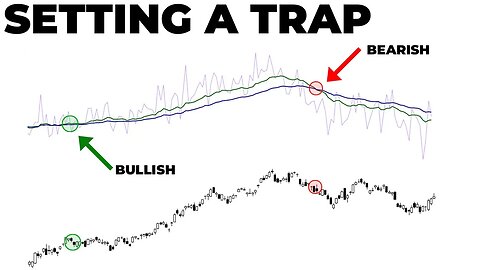
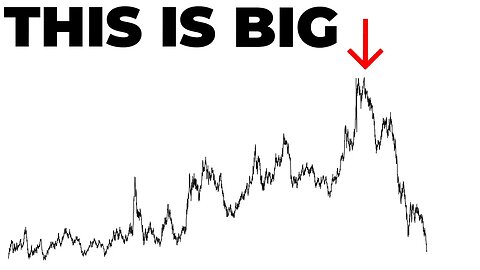
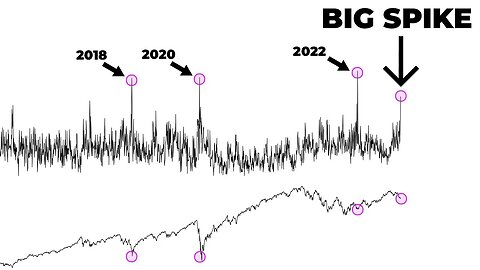
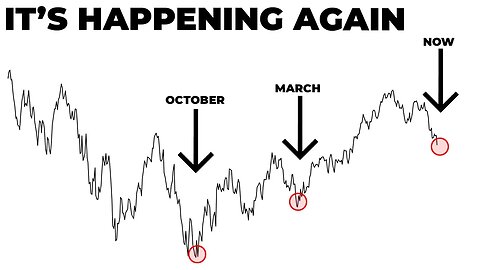
Powell Throws In the Towel
🟢 TRADE IDEAS & DISCORD: https://www.patreon.com/figuringoutmoney
🟢 GREAT BROKERAGE ACCOUNT: http://bit.ly/3mIUUfC
🟢 TRY TO BECOME A FUNDED TRADER: http://tracking.topsteptrader.com/SHZS
🟢 BOOKMAP DISCOUNT (PROMO CODE "BM20" for 20% off the monthly plans): https://bookmap.com/members/aff/go/figuringoutmoney?i=79
🟢 TODAY'S CHART DECK: https://www.slideshare.net/MichaelSilva144/stock-market-brief-deck-1214pdf
__________________________________________________________________________________________
In tonight's stock market brief show we discuss how the stock market responded to the rate decision by the Federal Reserve (Jerome Powell). We look into bonds, yields, copper, S&P500, and various stock market indicators to prepare for what may happen next.
🔔 Subscribe now and never miss an update: https://www.youtube.com/c/figuringoutmoney?sub_confirmation=1
📧 For business inquiries or collaboration opportunities, please contact us at FiguringOutMoney@gmail.com
📈 Follow us on social media for more insights and updates:
🟢 Instagram: https://www.instagram.com/figuringoutmoney
🟢 Twitter: https://twitter.com/mikepsilva
______________________________________________________________________________________________
How To Predict How Far Stocks Can Go (EXPECTED MOVES):
○ https://youtu.be/JT32L89ZpEk
Saylor To Schiff Bitcoin Indicator:
○ https://youtu.be/zuG9Tjnud9k
Show Me The Money Scan:
○ https://youtu.be/dzRjEuUUb5g
Party Starter Scan:
○ https://youtu.be/zzaN91gcJOI
Bouncy Ball Scan:
○ https://youtu.be/7xKOo6vNaq8
Dark Money Scan:
○ https://youtu.be/ZUMuHaSg1ro
Sleepy Monster Scan:
○ https://youtu.be/C9EQkA7uVU8
High Volatility Scan:
○ https://youtu.be/VC327ko8DfE
______________________________________________________________________________________________
DISCLAIMER: I am not a professional investment advisor, nor do I claim to be. All my videos are for entertainment and educational purposes only. This is not trading advice. I am wrong all the time. Everything you watch on my channel is my opinion. Links included in this description might be affiliate links. If you purchase a product or service with the links that I provide I may receive a small commission. There is no additional charge to you! Thank you for supporting my channel :)
#Stockmarket #StockMarketAnalysis #DayTrading
24
views
Weird Things Are Happening Right Now
🟢 TRADE IDEAS & DISCORD: https://www.patreon.com/figuringoutmoney
🟢 GREAT BROKERAGE ACCOUNT: http://bit.ly/3mIUUfC
🟢 TRY TO BECOME A FUNDED TRADER: http://tracking.topsteptrader.com/SHZS
🟢 TODAY'S CHART DECK: https://www.slideshare.net/MichaelSilva144/stock-market-brief-deck-125pdf
__________________________________________________________________________________________
Welcome to the Stock Brief Show! In this episode, we provide a deep dive into the rapidly changing world of financial markets and risk assessment. We begin by analyzing the Fed funds futures through the Fed Watch Tool, which suggests a high likelihood of rate cuts in the near future. We explore what this could mean for the market and investors.
Next, we examine the significance of the inverted yield curve, a historical predictor of economic recessions. We look at past instances and discuss the potential implications for the current market environment.
We also delve into the increase in 401(k) hardship withdrawals, highlighting the reasons behind this trend and its potential impact on investors' portfolios.
Market sentiment is a crucial factor, and we explore various indicators, such as the Fear and Greed Index, Goldman Sachs' US Panic Index, and options market behavior, providing insights into the current market conditions.
Asset analysis covers gold and oil, with insights into their recent movements and what they may signify for investors. Additionally, we introduce the Saylor-to-Schiff tool, offering a unique perspective on analyzing Bitcoin's price movements.
Market rotation and its effects on major stocks and indices are discussed, providing valuable insights into recent market trends. Technical analysis, including moving averages and gamma exposure levels, is explored to gauge market conditions and potential future volatility.
In closing, we offer a valuable insight into becoming a better trader by bridging the gap between what you know and what you actually do in the market. By narrowing this gap, you can make more informed and profitable trading decisions. Stay tuned for more valuable insights, market analysis, and actionable information to navigate the complex world of finance. Don't forget to like, subscribe, and share this video with fellow investors to keep them informed!
🔔 Subscribe now and never miss an update: https://www.youtube.com/c/figuringoutmoney?sub_confirmation=1
📧 For business inquiries or collaboration opportunities, please contact us at FiguringOutMoney@gmail.com
📈 Follow us on social media for more insights and updates:
🟢 Instagram: https://www.instagram.com/figuringoutmoney
🟢 Twitter: https://twitter.com/mikepsilva
______________________________________________________________________________________________
How To Predict How Far Stocks Can Go (EXPECTED MOVES):
○ https://youtu.be/JT32L89ZpEk
Saylor To Schiff Bitcoin Indicator:
○ https://youtu.be/zuG9Tjnud9k
Show Me The Money Scan:
○ https://youtu.be/dzRjEuUUb5g
Party Starter Scan:
○ https://youtu.be/zzaN91gcJOI
Bouncy Ball Scan:
○ https://youtu.be/7xKOo6vNaq8
Dark Money Scan:
○ https://youtu.be/ZUMuHaSg1ro
Sleepy Monster Scan:
○ https://youtu.be/C9EQkA7uVU8
High Volatility Scan:
○ https://youtu.be/VC327ko8DfE
______________________________________________________________________________________________
DISCLAIMER: I am not a professional investment advisor, nor do I claim to be. All my videos are for entertainment and educational purposes only. This is not trading advice. I am wrong all the time. Everything you watch on my channel is my opinion. Links included in this description might be affiliate links. If you purchase a product or service with the links that I provide I may receive a small commission. There is no additional charge to you! Thank you for supporting my channel :)
#Stockmarket #StockMarketAnalysis #DayTrading
18
views
Get A Closer Look At This Stock Market Rally!
🟢 TRADE IDEAS & DISCORD: https://www.patreon.com/figuringoutmoney
🟢 EARN A $50,000 FUNDED ACCOUNT for $49: http://tracking.topsteptrader.com/SHZS
🟢 GREAT BROKERAGE ACCOUNT: http://bit.ly/3mIUUfC
🟢 TODAY'S CHART DECK: https://www.slideshare.net/MichaelSilva144/stock-market-brief-deckpdf-a391
🟢 BOOKMAP DISCOUNT (PROMO CODE "BM20" for 20% off the monthly plans): https://bookmap.com/members/aff/go/figuringoutmoney?i
__________________________________________________________________________________________
In tonights video, I analyze the performance of various financial markets, providing insights and commentary on recent trends and potential implications for investors. The video covers a range of topics, including stock market performance, commodity prices (specifically, oil and copper), currency exchange rates (the dollar), bond yields, and market indicators (such as the put-to-call ratio and the Smart Money vs. Dumb Money indicator).
The presenter starts by discussing how the market performed, highlighting that technology and the NASDAQ composite led the way. They emphasize the performance of consumer discretionary and technology sectors, particularly in mega-cap names. However, they also note that energy stocks faced significant declines, which could be indicative of economic sensitivity and concerns about a potential recession.
The video dives into technical analysis, referencing moving averages and chart patterns to assess the outlook for various assets, including oil, the S&P 500, and copper. The presenter suggests that certain indicators may point to future market moves, such as divergences between copper and the S&P 500.
Additionally, the video explores the relationship between the dollar's value and stock market performance, highlighting historical correlations and the impact of recent dollar movements on the S&P 500.
The presenter also touches on bond market volatility and the yield curve, discussing the potential implications for different asset classes and the overall market.
Towards the end of the video, the presenter introduces tools like the Put-to-Call Ratio and the Smart Money vs. Dumb Money indicator to evaluate market sentiment and potential turning points. They offer insights into the current state of these indicators and their historical significance.
Lastly, the video provides key levels and support/resistance levels for the S&P 500, shedding light on potential price targets and areas to watch in the coming days.
Overall, this video offers a comprehensive analysis of financial markets, helping viewers gain a better understanding of recent market movements and potential future developments. It serves as a valuable resource for those interested in stock market analysis and trading strategies.
🔔 Subscribe now and never miss an update: https://www.youtube.com/c/figuringoutmoney?sub_confirmation=1
📧 For business inquiries or collaboration opportunities, please contact us at FiguringOutMoney@gmail.com
📈 Follow us on social media for more insights and updates:
🟢 Instagram: https://www.instagram.com/figuringoutmoney
🟢 Twitter: https://twitter.com/mikepsilva
______________________________________________________________________________________________
How To Predict How Far Stocks Can Go (EXPECTED MOVES):
○ https://youtu.be/JT32L89ZpEk
Saylor To Schiff Bitcoin Indicator:
○ https://youtu.be/zuG9Tjnud9k
Show Me The Money Scan:
○ https://youtu.be/dzRjEuUUb5g
Party Starter Scan:
○ https://youtu.be/zzaN91gcJOI
Bouncy Ball Scan:
○ https://youtu.be/7xKOo6vNaq8
Dark Money Scan:
○ https://youtu.be/ZUMuHaSg1ro
Sleepy Monster Scan:
○ https://youtu.be/C9EQkA7uVU8
High Volatility Scan:
○ https://youtu.be/VC327ko8DfE
______________________________________________________________________________________________
DISCLAIMER: I am not a professional investment advisor, nor do I claim to be. All my videos are for entertainment and educational purposes only. This is not trading advice. I am wrong all the time. Everything you watch on my channel is my opinion. Links included in this description might be affiliate links. If you purchase a product or service with the links that I provide I may receive a small commission. There is no additional charge to you! Thank you for supporting my channel :)
#Stockmarket #StockMarketAnalysis #DayTrading
45
views
The Stock Market's Biggest Competitor Is Looking Better And Better.
🟢 TRADE IDEAS & DISCORD: https://www.patreon.com/figuringoutmoney
🟢 BECOME A FUNDED TRADER: http://tracking.topsteptrader.com/aff_c?offer_id=75&aff_id=5115
🟢 GREAT BROKERAGE ACCOUNT: http://bit.ly/3mIUUfC
🟢 TODAY'S CHART DECK: https://www.slideshare.net/MichaelSilva144/stock-market-brief-deck-for-1027pdf
🟢 BOOKMAP DISCOUNT (PROMO CODE "BM20" for 20% off the monthly plans): https://bookmap.com/members/aff/go/figuringoutmoney?i=79
__________________________________________________________________________________________
In today's stock market brief, Michael Silva discusses the recent surge in stock market volatility, which has been impacting major market cap leaders. He delves into the emergence of a risk-free competitor to the stock market and conducts a thorough examination through the lens of technical financial market analysis. Throughout the video, Michael covers a wide range of topics, including the performance of various sectors, the behavior of the 10-year yield, and the rotation of investors into safety assets.
He highlights the relative strength of assets like gold, utilities, consumer staples, TLT, and healthcare, shedding light on their significance in the current market landscape. Michael also provides insights into the performance of tech giants such as Microsoft, Google, Apple, NVIDIA, Amazon, and Tesla, while noting the ongoing rotation trends in the market.
He explores the intriguing relationship between the dollar, gold, and yields and how it could potentially impact the broader market. Michael emphasizes the importance of being prepared for market opportunities, especially in times of heightened volatility.
Towards the end of the video, Michael analyzes market breadth indicators and explains their significance in gauging market health and potential turning points. He wraps up the discussion with insights into the weekly expected move and its implications for traders and investors.
Join Michael Silva in today's stock market brief for a comprehensive look at the current financial landscape and valuable insights into market trends and potential opportunities.
🔔 Subscribe now and never miss an update: https://www.youtube.com/c/figuringoutmoney?sub_confirmation=1
📧 For business inquiries or collaboration opportunities, please contact us at FiguringOutMoney@gmail.com
📈 Follow us on social media for more insights and updates:
🟢 Instagram: https://www.instagram.com/figuringoutmoney
🟢 Twitter: https://twitter.com/mikepsilva
______________________________________________________________________________________________
How To Predict How Far Stocks Can Go (EXPECTED MOVES):
○ https://youtu.be/JT32L89ZpEk
Saylor To Schiff Bitcoin Indicator:
○ https://youtu.be/zuG9Tjnud9k
Show Me The Money Scan:
○ https://youtu.be/dzRjEuUUb5g
Party Starter Scan:
○ https://youtu.be/zzaN91gcJOI
Bouncy Ball Scan:
○ https://youtu.be/7xKOo6vNaq8
Dark Money Scan:
○ https://youtu.be/ZUMuHaSg1ro
Sleepy Monster Scan:
○ https://youtu.be/C9EQkA7uVU8
High Volatility Scan:
○ https://youtu.be/VC327ko8DfE
______________________________________________________________________________________________
DISCLAIMER: I am not a professional investment advisor, nor do I claim to be. All my videos are for entertainment and educational purposes only. This is not trading advice. I am wrong all the time. Everything you watch on my channel is my opinion. Links included in this description might be affiliate links. If you purchase a product or service with the links that I provide I may receive a small commission. There is no additional charge to you! Thank you for supporting my channel :)
#Stockmarket #StockMarketAnalysis #DayTrading
39
views
We Still Got Wide Open Spaces!
🟢 TRADE IDEAS & DISCORD: https://www.patreon.com/figuringoutmoney
🟢 BECOME A FUNDED TRADER: http://tracking.topsteptrader.com/aff_c?offer_id=75&aff_id=5115
🟢 TRADE WITH IBKR: http://bit.ly/3mIUUfC
🟢 CHART DECK: https://www.slideshare.net/MichaelSilva144/stock-market-brief-deck-1025pdf
🟢 BOOKMAP DISCOUNT (PROMO CODE "BM20" for 20% off the monthly plans): https://bookmap.com/members/aff/go/figuringoutmoney?i=79
__________________________________________________________________________________________
In this video, we delve into the 11 sectors of the S&P 500, focusing on the leading sectors such as utilities and real estate. We discuss the significance of rate-sensitive sectors and the impact of rising rates. The video highlights the performance of NextEra Energy and its influence on the utilities sector. We also touch upon the energy sector, the 10-year yield, and the TLT.
The video provides insights into the performance of major companies like Microsoft and Google after their earnings reports. We also preview upcoming earnings reports from major companies like Meta (formerly Facebook) and Amazon.
We explore the correlation between the dollar's performance and the S&P 500, as well as the performance of commodities like gold and copper. The video also delves into the relationship between Bitcoin and the S&P 500, suggesting potential market trends based on Bitcoin's performance.
The video introduces the "sailor to shift" tool, a useful indicator for Bitcoin trading, and provides a detailed analysis of the S&P 500 on the 15-minute timeframe. We also discuss the potential market impact of upcoming economic data releases and speeches by key figures like Fed Chair Powell.
Lastly, the video emphasizes the importance of being cautious in a volatile market, highlighting the challenges of short-selling and the potential for market fake-outs.
Tune in for a comprehensive market analysis and valuable insights to guide your trading decisions!
🔔 Subscribe now and never miss an update: https://www.youtube.com/c/figuringoutmoney?sub_confirmation=1
📧 For business inquiries or collaboration opportunities, please contact us at FiguringOutMoney@gmail.com
📈 Follow us on social media for more insights and updates:
🟢 Instagram: https://www.instagram.com/figuringoutmoney
🟢 Twitter: https://twitter.com/mikepsilva
______________________________________________________________________________________________
How To Predict How Far Stocks Can Go (EXPECTED MOVES):
○ https://youtu.be/JT32L89ZpEk
Saylor To Schiff Bitcoin Indicator:
○ https://youtu.be/zuG9Tjnud9k
Show Me The Money Scan:
○ https://youtu.be/dzRjEuUUb5g
Party Starter Scan:
○ https://youtu.be/zzaN91gcJOI
Bouncy Ball Scan:
○ https://youtu.be/7xKOo6vNaq8
Dark Money Scan:
○ https://youtu.be/ZUMuHaSg1ro
Sleepy Monster Scan:
○ https://youtu.be/C9EQkA7uVU8
High Volatility Scan:
○ https://youtu.be/VC327ko8DfE
______________________________________________________________________________________________
DISCLAIMER: I am not a professional investment advisor, nor do I claim to be. All my videos are for entertainment and educational purposes only. This is not trading advice. I am wrong all the time. Everything you watch on my channel is my opinion. Links included in this description might be affiliate links. If you purchase a product or service with the links that I provide I may receive a small commission. There is no additional charge to you! Thank you for supporting my channel :)
#Stockmarket #StockMarketAnalysis #DayTrading
119
views
NEXT STOCK MARKET MOVE WILL BE EXPLOSIVE! 🧨
🟢 BOOKMAP DISCOUNT (PROMO CODE "BM20" for 20% off the monthly plans): https://bookmap.com/members/aff/go/figuringoutmoney?i=79
🟢 TRADE IDEAS & DISCORD: https://www.patreon.com/figuringoutmoney
🟢 TRADE WITH IBKR: http://bit.ly/3mIUUfC
🟢 CHART DECK: https://www.slideshare.net/MichaelSilva144/stock-market-brief-deck-1014pdf
__________________________________________________________________________________________
Welcome back to our in-depth financial analysis show! In this episode, we embark on a comprehensive journey through the intricate world of finance. We begin by exploring the renowned Marty Zweig's investment principles, emphasizing his golden rule: "The trend is your friend." Delving deeper, we discuss the significance of market trends and the potential pitfalls of going against them. The intricacies of the Federal Reserve's balance sheet adjustments come into focus as we shed light on the current tightening phase, its implications, and the historical context of such actions. With inflation rates consistently making headlines, we break down the numbers, including the recent Producer Price Inflation data, and discuss the core inflation rate and its real-world implications for everyday consumers. Our analysis also takes us through credit growth patterns dating back to 1975, highlighting its correlation with past recessions and economic downturns. The 10-year minus 2-year yield curve, historically a predictor of economic events, is explored in detail, revealing insights into its current status and potential future indications. Additionally, we dive deep into key levels for the S&P 500, using technical analysis to provide a clearer perspective on potential market movements. We conclude with a closer look at the VIX, its historical spikes, and their significance for the market, discussing its correlation with the Federal funds rate and potential market events on the horizon. Join us for this enlightening episode as we dissect these topics and more, equipping you with actionable insights and a clearer understanding of the current financial landscape.
TIMESTAMPS: 00:00
State of the economy: 00:50
Weekly Performance: 13:14
On Deck: 14:04
Volatility: 14:48
S&P 500 Analysis: 17:58
Bonds & Yields: 24:04
Dollar Analysis: 28:53
Commodities: 29:05
Stock Market Indicators: 33:10
Chart of the Week: 37:25
🔔 Subscribe now and never miss an update: https://www.youtube.com/c/figuringoutmoney?sub_confirmation=1
📧 For business inquiries or collaboration opportunities, please contact us at FiguringOutMoney@gmail.com
📈 Follow us on social media for more insights and updates:
🟢 Instagram: https://www.instagram.com/figuringoutmoney
🟢 Twitter: https://twitter.com/mikepsilva
______________________________________________________________________________________________
How To Predict How Far Stocks Can Go (EXPECTED MOVES):
○ https://youtu.be/JT32L89ZpEk
Saylor To Schiff Bitcoin Indicator:
○ https://youtu.be/zuG9Tjnud9k
Show Me The Money Scan:
○ https://youtu.be/dzRjEuUUb5g
Party Starter Scan:
○ https://youtu.be/zzaN91gcJOI
Bouncy Ball Scan:
○ https://youtu.be/7xKOo6vNaq8
Dark Money Scan:
○ https://youtu.be/ZUMuHaSg1ro
Sleepy Monster Scan:
○ https://youtu.be/C9EQkA7uVU8
High Volatility Scan:
○ https://youtu.be/VC327ko8DfE
______________________________________________________________________________________________
DISCLAIMER: I am not a professional investment advisor, nor do I claim to be. All my videos are for entertainment and educational purposes only. This is not trading advice. I am wrong all the time. Everything you watch on my channel is my opinion. Links included in this description might be affiliate links. If you purchase a product or service with the links that I provide I may receive a small commission. There is no additional charge to you! Thank you for supporting my channel :)
#Stockmarket #StockMarketAnalysis #DayTrading
30
views
Banks Are In For A Wild Ride!
🟢 TRADE IDEAS & DISCORD: https://www.patreon.com/figuringoutmoney
🟢 TRADE WITH IBKR: http://bit.ly/3mIUUfC
🟢 BOOKMAP DISCOUNT (PROMO CODE "BM20" for 20% off the monthly plans): https://bookmap.com/members/aff/go/figuringoutmoney?i=79
__________________________________________________________________________________________
The video script discusses the financial market, focusing on the earnings reports of major banks like JPM, City Group, BlackRock, Wells Fargo, and PNC. The presenter delves into the volatility storm, highlighting the implied volatility they've observed and the key expected moves for these banks. The video also touches on recent inflation data, noting that core inflation is down and discussing the implications of this data on the market. The presenter provides a detailed analysis of various market indicators, such as the 10-year yield, the dollar's performance, and the S&P 500's movements. The video emphasizes the importance of financials in the S&P 500, especially with the upcoming earnings reports from big banks. The presenter offers insights into potential market movements, suggesting that viewers might consider buying on dips. The video concludes with a cautionary note, advising viewers to be careful given the expected volatility in the market.
🔔 Subscribe now and never miss an update: https://www.youtube.com/c/figuringoutmoney?sub_confirmation=1
📧 For business inquiries or collaboration opportunities, please contact us at FiguringOutMoney@gmail.com
📈 Follow us on social media for more insights and updates:
🟢 Instagram: https://www.instagram.com/figuringoutmoney
🟢 Twitter: https://twitter.com/mikepsilva
______________________________________________________________________________________________
How To Predict How Far Stocks Can Go (EXPECTED MOVES):
○ https://youtu.be/JT32L89ZpEk
Saylor To Schiff Bitcoin Indicator:
○ https://youtu.be/zuG9Tjnud9k
Show Me The Money Scan:
○ https://youtu.be/dzRjEuUUb5g
Party Starter Scan:
○ https://youtu.be/zzaN91gcJOI
Bouncy Ball Scan:
○ https://youtu.be/7xKOo6vNaq8
Dark Money Scan:
○ https://youtu.be/ZUMuHaSg1ro
Sleepy Monster Scan:
○ https://youtu.be/C9EQkA7uVU8
High Volatility Scan:
○ https://youtu.be/VC327ko8DfE
______________________________________________________________________________________________
DISCLAIMER: I am not a professional investment advisor, nor do I claim to be. All my videos are for entertainment and educational purposes only. This is not trading advice. I am wrong all the time. Everything you watch on my channel is my opinion. Links included in this description might be affiliate links. If you purchase a product or service with the links that I provide I may receive a small commission. There is no additional charge to you! Thank you for supporting my channel :)
#Stockmarket #StockMarketAnalysis #DayTrading
25
views
Momentum Slowing, Divergences Growing: What Does This Mean For The Markets?
🟢 TRADE IDEAS & DISCORD: https://www.patreon.com/figuringoutmoney
🟢 TRADE WITH IBKR: http://bit.ly/3mIUUfC
🟢 BOOKMAP DISCOUNT (PROMO CODE "BM20" for 20% off the monthly plans): https://bookmap.com/members/aff/go/figuringoutmoney?i=79
__________________________________________________________________________________________
Tonight's video delves into a comprehensive analysis of the financial markets, emphasizing the slowing momentum and building divergences. It begins by highlighting the release of the producer price inflation data, which surprisingly came in hotter than expected. Despite this revelation, the markets showcased a relatively flat performance. The volatility index (VIX) and the various sectors within the S&P 500 are discussed, shedding light on their recent movements. The narrative then shifts to the 10-year yield, which has been moving within a defined channel, and the TLT (a bond ETF) that has been navigating against declining moving averages. An intriguing aspect of the script is its focus on the divergences observed in the market. These divergences, especially between high yield and equity markets as well as between copper and the S&P 500, are flagged as potential warning signs. The movement of the dollar is also explored, emphasizing its correlation with the S&P 500. Other assets, including oil, gold, Bitcoin, and Ethereum, are touched upon, providing insights into their recent trajectories and the factors influencing them. Delving deeper into technical analysis, the script underscores the nuances of candlestick charting, particularly the diminishing momentum evident from the decreasing body sizes of consecutive green candles. The significance of expected move levels and potential resistance points in the market are also highlighted. Concluding the analysis, the script offers a short-term outlook for the markets, stressing the importance of the impending inflation data and its potential ramifications on market movements.
🔔 Subscribe now and never miss an update: https://www.youtube.com/c/figuringoutmoney?sub_confirmation=1
📧 For business inquiries or collaboration opportunities, please contact us at FiguringOutMoney@gmail.com
📈 Follow us on social media for more insights and updates:
🟢 Instagram: https://www.instagram.com/figuringoutmoney
🟢 Twitter: https://twitter.com/mikepsilva
______________________________________________________________________________________________
How To Predict How Far Stocks Can Go (EXPECTED MOVES):
○ https://youtu.be/JT32L89ZpEk
Saylor To Schiff Bitcoin Indicator:
○ https://youtu.be/zuG9Tjnud9k
Show Me The Money Scan:
○ https://youtu.be/dzRjEuUUb5g
Party Starter Scan:
○ https://youtu.be/zzaN91gcJOI
Bouncy Ball Scan:
○ https://youtu.be/7xKOo6vNaq8
Dark Money Scan:
○ https://youtu.be/ZUMuHaSg1ro
Sleepy Monster Scan:
○ https://youtu.be/C9EQkA7uVU8
High Volatility Scan:
○ https://youtu.be/VC327ko8DfE
______________________________________________________________________________________________
DISCLAIMER: I am not a professional investment advisor, nor do I claim to be. All my videos are for entertainment and educational purposes only. This is not trading advice. I am wrong all the time. Everything you watch on my channel is my opinion. Links included in this description might be affiliate links. If you purchase a product or service with the links that I provide I may receive a small commission. There is no additional charge to you! Thank you for supporting my channel :)
#Stockmarket #StockMarketAnalysis #DayTrading
29
views
Back To Reality! Watch Out For Gravity!
🟢 TRADE IDEAS & DISCORD: https://www.patreon.com/figuringoutmoney
🟢 TRADE WITH IBKR: http://bit.ly/3mIUUfC
🟢 BOOKMAP DISCOUNT (PROMO CODE "BM20" for 20% off the monthly plans): https://bookmap.com/members/aff/go/figuringoutmoney?i=79
__________________________________________________________________________________________
TIMESTAMPS: 00:00
Market Snapshot: 00:47
On Deck: 4:47
Intermarket Analysis: 06:37
S&P 500 Analysis: 09:51
Stock Market Indicators: 13:12
The video focuses on analyzing the current state of the financial markets, specifically the S&P 500, and various indicators that might suggest potential shifts in the market's direction. The host begins by noting recent positive movements in the market but raises the question of whether this rally is sustainable or if a reality check is imminent.
Throughout the video, the host delves into various market indicators and assets, such as the performance of small caps, the behavior of tech giants like Microsoft, Apple, and Google, and the significance of the five-day moving average. The video also touches on the importance of intermarket dynamics, highlighting the relationship between the 10-year yield and its impact on growth stocks. The host emphasizes the importance of being patient in the current market environment and discusses the potential volatility due to the negative gamma environment.
The video also covers macroeconomic data points that could influence the market, such as PPI, FOMC minutes, core inflation data, and Michigan consumer sentiment. Additionally, the host mentions upcoming earnings reports from major financial institutions and other significant companies. The video provides a detailed analysis of various stocks and sectors, pointing out patterns and potential setups for traders.
Towards the end, the host introduces the "Old Fool Indicator," a tool that tracks the NASDAQ composite's performance relative to the put-to-call ratio. This indicator, along with others discussed, provides insights into potential long-term trend changes in the market.
In summary, the video offers a comprehensive analysis of the current state of the financial markets, highlighting potential opportunities, risks, and key indicators that traders and investors should be aware of. The host emphasizes the importance of understanding the broader market context and being strategic in one's trading approach.
🔔 Subscribe now and never miss an update: https://www.youtube.com/c/figuringoutmoney?sub_confirmation=1
📧 For business inquiries or collaboration opportunities, please contact us at FiguringOutMoney@gmail.com
📈 Follow us on social media for more insights and updates:
🟢 Instagram: https://www.instagram.com/figuringoutmoney
🟢 Twitter: https://twitter.com/mikepsilva
______________________________________________________________________________________________
How To Predict How Far Stocks Can Go (EXPECTED MOVES):
○ https://youtu.be/JT32L89ZpEk
Saylor To Schiff Bitcoin Indicator:
○ https://youtu.be/zuG9Tjnud9k
Show Me The Money Scan:
○ https://youtu.be/dzRjEuUUb5g
Party Starter Scan:
○ https://youtu.be/zzaN91gcJOI
Bouncy Ball Scan:
○ https://youtu.be/7xKOo6vNaq8
Dark Money Scan:
○ https://youtu.be/ZUMuHaSg1ro
Sleepy Monster Scan:
○ https://youtu.be/C9EQkA7uVU8
High Volatility Scan:
○ https://youtu.be/VC327ko8DfE
______________________________________________________________________________________________
DISCLAIMER: I am not a professional investment advisor, nor do I claim to be. All my videos are for entertainment and educational purposes only. This is not trading advice. I am wrong all the time. Everything you watch on my channel is my opinion. Links included in this description might be affiliate links. If you purchase a product or service with the links that I provide I may receive a small commission. There is no additional charge to you! Thank you for supporting my channel :)
#Stockmarket #StockMarketAnalysis #DayTrading
8
views
Your Next Opportunity Is Right Around The Corner!
🟢 TRADE IDEAS & DISCORD: https://www.patreon.com/figuringoutmoney
🟢 HOW I TRADE: http://bit.ly/3mIUUfC
🟢 CHART DECK: https://www.slideshare.net/MichaelSilva144/stock-market-brief-deck-109pdf
__________________________________________________________________________________________
In today's stock market show we dive deep into key levels of the magnificent 7 stocks of the SP500 (AAPL, MSFT, NVDA, TSLA, GOOGL, AMZN, META) and discuss where we can ramin bullish and where to get more bearish. I also dive deep dive into small cap stocks (IWM) and show you what it might look like when something breaks and how it creates great opportunities.
🔔 Subscribe now and never miss an update: https://www.youtube.com/c/figuringoutmoney?sub_confirmation=1
📧 For business inquiries or collaboration opportunities, please contact us at FiguringOutMoney@gmail.com
📈 Follow us on social media for more insights and updates:
🟢 Instagram: https://www.instagram.com/figuringoutmoney
🟢 Twitter: https://twitter.com/mikepsilva
______________________________________________________________________________________________
How To Predict How Far Stocks Can Go (EXPECTED MOVES):
○ https://youtu.be/JT32L89ZpEk
Saylor To Schiff Bitcoin Indicator:
○ https://youtu.be/zuG9Tjnud9k
Show Me The Money Scan:
○ https://youtu.be/dzRjEuUUb5g
Party Starter Scan:
○ https://youtu.be/zzaN91gcJOI
Bouncy Ball Scan:
○ https://youtu.be/7xKOo6vNaq8
Dark Money Scan:
○ https://youtu.be/ZUMuHaSg1ro
Sleepy Monster Scan:
○ https://youtu.be/C9EQkA7uVU8
High Volatility Scan:
○ https://youtu.be/VC327ko8DfE
______________________________________________________________________________________________
DISCLAIMER: I am not a professional investment advisor, nor do I claim to be. All my videos are for entertainment and educational purposes only. This is not trading advice. I am wrong all the time. Everything you watch on my channel is my opinion. Links included in this description might be affiliate links. If you purchase a product or service with the links that I provide I may receive a small commission. There is no additional charge to you! Thank you for supporting my channel :)
#Stockmarket #StockMarketAnalysis #DayTrading
5
views
Let's Get Ready To Rumble!
🟢 TRADE IDEAS & DISCORD: https://www.patreon.com/figuringoutmoney
🟢 TRADING PLATFORM: http://bit.ly/3mIUUfC
__________________________________________________________________________________________
In this episode of the Stock Market Brief Show with Michael Silva, we delve into the intricacies of the stock market's current state. Despite appearing calm, the market displayed significant intraday volatility. We explore both bullish and bearish market perspectives, highlighting the importance of understanding market movements between contraction and expansion. Special attention is given to the put to call ratio, which has shown rare spikes, suggesting potential market turning points. Other indicators, such as the RSI and the percentage of stocks above their moving averages, hint at oversold conditions and potential bounces. However, caution is advised as these conditions can also precede market crashes. The episode also touches on the performance of major companies like Coca-Cola, PepsiCo, and General Motors, emphasizing the importance of staying updated with market trends. As we anticipate the release of job data and its potential impact, Michael underscores the significance of being prepared for market shifts.
🔔 Subscribe now and never miss an update: https://www.youtube.com/c/figuringoutmoney?sub_confirmation=1
📧 For business inquiries or collaboration opportunities, please contact us at FiguringOutMoney@gmail.com
📈 Follow us on social media for more insights and updates:
🟢 Instagram: https://www.instagram.com/figuringoutmoney
🟢 Twitter: https://twitter.com/mikepsilva
______________________________________________________________________________________________
How To Predict How Far Stocks Can Go (EXPECTED MOVES):
○ https://youtu.be/JT32L89ZpEk
Saylor To Schiff Bitcoin Indicator:
○ https://youtu.be/zuG9Tjnud9k
Show Me The Money Scan:
○ https://youtu.be/dzRjEuUUb5g
Party Starter Scan:
○ https://youtu.be/zzaN91gcJOI
Bouncy Ball Scan:
○ https://youtu.be/7xKOo6vNaq8
Dark Money Scan:
○ https://youtu.be/ZUMuHaSg1ro
Sleepy Monster Scan:
○ https://youtu.be/C9EQkA7uVU8
High Volatility Scan:
○ https://youtu.be/VC327ko8DfE
______________________________________________________________________________________________
DISCLAIMER: I am not a professional investment advisor, nor do I claim to be. All my videos are for entertainment and educational purposes only. This is not trading advice. I am wrong all the time. Everything you watch on my channel is my opinion. Links included in this description might be affiliate links. If you purchase a product or service with the links that I provide I may receive a small commission. There is no additional charge to you! Thank you for supporting my channel :)
#Stockmarket #StockMarketAnalysis #DayTrading
32
views
The Signal Returns
🟢 TRADE IDEAS & DISCORD: https://www.patreon.com/figuringoutmoney
🟢 TRADE WITH IBKR: http://bit.ly/3mIUUfC
__________________________________________________________________________________________
In this video, Michael Silva delves into the current state of the stock market, highlighting key signals and patterns that have emerged. He begins by referencing a recurring signal that has shown up during significant market moments, such as the October bottom and March 15th. The main focus of the video is on the stock market brief, with an emphasis on the S&P 500 and its confluence points.
Michael provides a snapshot of various market products, discussing the 10-year yield, the dollar, and Bitcoin. He points out that when these elements move in tandem, it often indicates problems in the overall market. The video also touches on the IWN's negative territory, the S&P 500's equal weight, and the influence of mega cap stocks.
The discussion then shifts to the 10-year yield, which has hit a new high for 2023. Michael draws attention to the parabolic trend of the yield and its potential implications. He also examines the 10-year two-year curve and the 10-year three-month curve, noting their impact on the market.
The video further explores the fear and greed index, which has been at extreme levels, and its historical significance in the market. Michael emphasizes the importance of understanding the confluence of various market indicators, such as the weekly expected move, the 200-day moving average, and the gamma exposure level.
Towards the end, Michael provides insights into potential market movements, suggesting that the current downward trend could be a bear trap. He advises viewers to be patient and tactical, keeping an eye on key market levels.
In summary, this video offers a comprehensive analysis of the stock market's current state, highlighting potential risks and opportunities. Michael Silva provides viewers with valuable insights and strategies to navigate the market effectively.
🔔 Subscribe now and never miss an update: https://www.youtube.com/c/figuringoutmoney?sub_confirmation=1
📧 For business inquiries or collaboration opportunities, please contact us at FiguringOutMoney@gmail.com
📈 Follow us on social media for more insights and updates:
🟢 Instagram: https://www.instagram.com/figuringoutmoney
🟢 Twitter: https://twitter.com/mikepsilva
______________________________________________________________________________________________
How To Predict How Far Stocks Can Go (EXPECTED MOVES):
○ https://youtu.be/JT32L89ZpEk
Saylor To Schiff Bitcoin Indicator:
○ https://youtu.be/zuG9Tjnud9k
Show Me The Money Scan:
○ https://youtu.be/dzRjEuUUb5g
Party Starter Scan:
○ https://youtu.be/zzaN91gcJOI
Bouncy Ball Scan:
○ https://youtu.be/7xKOo6vNaq8
Dark Money Scan:
○ https://youtu.be/ZUMuHaSg1ro
Sleepy Monster Scan:
○ https://youtu.be/C9EQkA7uVU8
High Volatility Scan:
○ https://youtu.be/VC327ko8DfE
______________________________________________________________________________________________
DISCLAIMER: I am not a professional investment advisor, nor do I claim to be. All my videos are for entertainment and educational purposes only. This is not trading advice. I am wrong all the time. Everything you watch on my channel is my opinion. Links included in this description might be affiliate links. If you purchase a product or service with the links that I provide I may receive a small commission. There is no additional charge to you! Thank you for supporting my channel :)
#Stockmarket #StockMarketAnalysis #DayTrading
6
views
Signs of a bounce, but beware!
🟢 TRADE IDEAS & DISCORD: https://www.patreon.com/figuringoutmoney
🟢 MY TRADING PLATFORM: http://bit.ly/3mIUUfC
__________________________________________________________________________________________
In this stock market analysis, we dive deep into the current market dynamics, highlighting potential signs of a market bounce while also emphasizing caution. We discuss the Russell 2000's surprising performance, the movement in the tech sector, and the significant shifts in utilities and consumer staples. Delving into technical analysis, we touch on the impact of the 10-year yield, the state of gold, and the intriguing developments in the NASDAQ. Join us as we analyze the stock market's pulse and what it means for investors. Don't forget to like, subscribe, and stay updated with the latest market trends!
🔔 Subscribe now and never miss an update: https://www.youtube.com/c/figuringoutmoney?sub_confirmation=1
📧 For business inquiries or collaboration opportunities, please contact us at FiguringOutMoney@gmail.com
📈 Follow us on social media for more insights and updates:
🟢 Instagram: https://www.instagram.com/figuringoutmoney
🟢 Twitter: https://twitter.com/mikepsilva
______________________________________________________________________________________________
How To Predict How Far Stocks Can Go (EXPECTED MOVES):
○ https://youtu.be/JT32L89ZpEk
Saylor To Schiff Bitcoin Indicator:
○ https://youtu.be/zuG9Tjnud9k
Show Me The Money Scan:
○ https://youtu.be/dzRjEuUUb5g
Party Starter Scan:
○ https://youtu.be/zzaN91gcJOI
Bouncy Ball Scan:
○ https://youtu.be/7xKOo6vNaq8
Dark Money Scan:
○ https://youtu.be/ZUMuHaSg1ro
Sleepy Monster Scan:
○ https://youtu.be/C9EQkA7uVU8
High Volatility Scan:
○ https://youtu.be/VC327ko8DfE
______________________________________________________________________________________________
DISCLAIMER: I am not a professional investment advisor, nor do I claim to be. All my videos are for entertainment and educational purposes only. This is not trading advice. I am wrong all the time. Everything you watch on my channel is my opinion. Links included in this description might be affiliate links. If you purchase a product or service with the links that I provide I may receive a small commission. There is no additional charge to you! Thank you for supporting my channel :)
#Stockmarket #StockMarketAnalysis #DayTrading
18
views
Don't Be Scared! This Isn't A Stock Market Selloff...Yet.
🟢 TRADE IDEAS & DISCORD: https://www.patreon.com/figuringoutmoney
🟢 MY TRADING PLATFORM: http://bit.ly/3mIUUfC
__________________________________________________________________________________________
In today's video Michael Silva analyzes prevailing market trends, focusing on the significance of October as the start of a new quarter. He observes the typical downturn in September, marked by red indicators, and discusses the impact of assets like crude oil and the 10-year yield on broader markets. Michael contrasts the drops in stocks like Apple and Amazon with gains in Microsoft and Tesla, and delves into the potential economic repercussions of government decisions on interest rates and inflation. He highlights the importance of upcoming economic indicators and advises viewers to watch for updates on earnings reports from major banks. Michael concludes by discussing the correlation between various indices and commodities and the overall market trends, emphasizing the importance of monitoring the 10-year yield for signs of market slowdown.
🔔 Subscribe now and never miss an update: https://www.youtube.com/c/figuringoutmoney?sub_confirmation=1
📧 For business inquiries or collaboration opportunities, please contact us at FiguringOutMoney@gmail.com
📈 Follow us on social media for more insights and updates:
🟢 Instagram: https://www.instagram.com/figuringoutmoney
🟢 Twitter: https://twitter.com/mikepsilva
______________________________________________________________________________________________
How To Predict How Far Stocks Can Go (EXPECTED MOVES):
○ https://youtu.be/JT32L89ZpEk
Saylor To Schiff Bitcoin Indicator:
○ https://youtu.be/zuG9Tjnud9k
Show Me The Money Scan:
○ https://youtu.be/dzRjEuUUb5g
Party Starter Scan:
○ https://youtu.be/zzaN91gcJOI
Bouncy Ball Scan:
○ https://youtu.be/7xKOo6vNaq8
Dark Money Scan:
○ https://youtu.be/ZUMuHaSg1ro
Sleepy Monster Scan:
○ https://youtu.be/C9EQkA7uVU8
High Volatility Scan:
○ https://youtu.be/VC327ko8DfE
______________________________________________________________________________________________
DISCLAIMER: I am not a professional investment advisor, nor do I claim to be. All my videos are for entertainment and educational purposes only. This is not trading advice. I am wrong all the time. Everything you watch on my channel is my opinion. Links included in this description might be affiliate links. If you purchase a product or service with the links that I provide I may receive a small commission. There is no additional charge to you! Thank you for supporting my channel :)
#Stockmarket #StockMarketAnalysis #DayTrading
6
views
This Rare Stock Market Signal Is About To Trigger...
🟢 BOOKMAP DISCOUNT (PROMO CODE "BM20" for 20% off the monthly plans): https://bookmap.com/members/aff/go/figuringoutmoney?i=79
🟢 TRADE IDEAS & DISCORD: https://www.patreon.com/figuringoutmoney
🟢 TRADE WITH IBKR: http://bit.ly/3mIUUfC
__________________________________________________________________________________________
In this comprehensive video, we take an in-depth look at the recent performance of the financial markets. We closely examine critical indicators, such as the S&P 500, and delve into the intricacies of yield curves and quarterly trends. Our analysis includes an exploration of potential bearish signals and offers valuable insights into the possible future trajectory of the market. For those seeking a deeper understanding of market dynamics and investment strategies, this video provides essential information
🔔 Subscribe now and never miss an update: https://www.youtube.com/c/figuringoutmoney?sub_confirmation=1
📧 For business inquiries or collaboration opportunities, please contact us at FiguringOutMoney@gmail.com
📈 Follow us on social media for more insights and updates:
🟢 Instagram: https://www.instagram.com/figuringoutmoney
🟢 Twitter: https://twitter.com/mikepsilva
______________________________________________________________________________________________
How To Predict How Far Stocks Can Go (EXPECTED MOVES):
○ https://youtu.be/JT32L89ZpEk
Saylor To Schiff Bitcoin Indicator:
○ https://youtu.be/zuG9Tjnud9k
Show Me The Money Scan:
○ https://youtu.be/dzRjEuUUb5g
Party Starter Scan:
○ https://youtu.be/zzaN91gcJOI
Bouncy Ball Scan:
○ https://youtu.be/7xKOo6vNaq8
Dark Money Scan:
○ https://youtu.be/ZUMuHaSg1ro
Sleepy Monster Scan:
○ https://youtu.be/C9EQkA7uVU8
High Volatility Scan:
○ https://youtu.be/VC327ko8DfE
______________________________________________________________________________________________
DISCLAIMER: I am not a professional investment advisor, nor do I claim to be. All my videos are for entertainment and educational purposes only. This is not trading advice. I am wrong all the time. Everything you watch on my channel is my opinion. Links included in this description might be affiliate links. If you purchase a product or service with the links that I provide I may receive a small commission. There is no additional charge to you! Thank you for supporting my channel :)
#Stockmarket #StockMarketAnalysis #DayTrading
52
views
2
comments
This Is Where Things Can Get Ugly For The Stock Market
🟢 BOOKMAP DISCOUNT (PROMO CODE "BM20" for 20% off the monthly plans): https://bookmap.com/members/aff/go/figuringoutmoney?i=79
🟢 TRADE IDEAS & DISCORD: https://www.patreon.com/figuringoutmoney
🟢 TRADE WITH IBKR: http://bit.ly/3mIUUfC
__________________________________________________________________________________________
In this episode, we delve into the current economic landscape, and things are looking rather uncertain. The two-year yield has spiked to 5.12%, a level we haven't witnessed since 2006. Jerome Powell's recent statements didn't sit well with the markets, and we're seeing topping patterns emerge in the stock market. Join us as we break down these critical market indicators and discuss what they mean for investors. Stay tuned for a comprehensive overview of the latest developments in the stock market.
🔔 Subscribe now and never miss an update: https://www.youtube.com/c/figuringoutmoney?sub_confirmation=1
📧 For business inquiries or collaboration opportunities, please contact us at FiguringOutMoney@gmail.com
📈 Follow us on social media for more insights and updates:
🟢 Instagram: https://www.instagram.com/figuringoutmoney
🟢 Twitter: https://twitter.com/mikepsilva
______________________________________________________________________________________________
How To Predict How Far Stocks Can Go (EXPECTED MOVES):
○ https://youtu.be/JT32L89ZpEk
Saylor To Schiff Bitcoin Indicator:
○ https://youtu.be/zuG9Tjnud9k
Show Me The Money Scan:
○ https://youtu.be/dzRjEuUUb5g
Party Starter Scan:
○ https://youtu.be/zzaN91gcJOI
Bouncy Ball Scan:
○ https://youtu.be/7xKOo6vNaq8
Dark Money Scan:
○ https://youtu.be/ZUMuHaSg1ro
Sleepy Monster Scan:
○ https://youtu.be/C9EQkA7uVU8
High Volatility Scan:
○ https://youtu.be/VC327ko8DfE
______________________________________________________________________________________________
DISCLAIMER: I am not a professional investment advisor, nor do I claim to be. All my videos are for entertainment and educational purposes only. This is not trading advice. I am wrong all the time. Everything you watch on my channel is my opinion. Links included in this description might be affiliate links. If you purchase a product or service with the links that I provide I may receive a small commission. There is no additional charge to you! Thank you for supporting my channel :)
#Stockmarket #StockMarketAnalysis #DayTrading
32
views
Housing Market On The Edge: Will The Sp500 Crumble Next?
🟢 BOOKMAP DISCOUNT (PROMO CODE "BM20" for 20% off the monthly plans): https://bookmap.com/members/aff/go/figuringoutmoney?i=79
🟢 TRADE IDEAS & DISCORD: https://www.patreon.com/figuringoutmoney
🟢 TRADE WITH IBKR: http://bit.ly/3mIUUfC
__________________________________________________________________________________________
In this episode of the Stock Market Brief, we delve into the latest market trends and analysis using technical and intermarket analysis. We explore how the market responded to recent macroeconomic data, discuss signs of volatility, and examine intermarket assets like the 10-year yield, the dollar, and oil. An exciting highlight is our exploration of the housing market's impact on the broader S&P 500 trend. Stay tuned for insights, risk range analysis, and a tactical approach to market movements.
🔔 Subscribe now and never miss an update: https://www.youtube.com/c/figuringoutmoney?sub_confirmation=1
📧 For business inquiries or collaboration opportunities, please contact us at FiguringOutMoney@gmail.com
📈 Follow us on social media for more insights and updates:
🟢 Instagram: https://www.instagram.com/figuringoutmoney
🟢 Twitter: https://twitter.com/mikepsilva
______________________________________________________________________________________________
How To Predict How Far Stocks Can Go (EXPECTED MOVES):
○ https://youtu.be/JT32L89ZpEk
Saylor To Schiff Bitcoin Indicator:
○ https://youtu.be/zuG9Tjnud9k
Show Me The Money Scan:
○ https://youtu.be/dzRjEuUUb5g
Party Starter Scan:
○ https://youtu.be/zzaN91gcJOI
Bouncy Ball Scan:
○ https://youtu.be/7xKOo6vNaq8
Dark Money Scan:
○ https://youtu.be/ZUMuHaSg1ro
Sleepy Monster Scan:
○ https://youtu.be/C9EQkA7uVU8
High Volatility Scan:
○ https://youtu.be/VC327ko8DfE
______________________________________________________________________________________________
DISCLAIMER: I am not a professional investment advisor, nor do I claim to be. All my videos are for entertainment and educational purposes only. This is not trading advice. I am wrong all the time. Everything you watch on my channel is my opinion. Links included in this description might be affiliate links. If you purchase a product or service with the links that I provide I may receive a small commission. There is no additional charge to you! Thank you for supporting my channel :)
#Stockmarket #StockMarketAnalysis #DayTrading
15
views
Aliens Are Coming To Save The Stock Market!
🟢 BOOKMAP DISCOUNT (PROMO CODE "BM20" for 20% off the monthly plans): https://bookmap.com/members/aff/go/figuringoutmoney?i=79
🟢 TRADE IDEAS & DISCORD: https://www.patreon.com/figuringoutmoney
🟢 TRADE WITH IBKR: http://bit.ly/3mIUUfC
__________________________________________________________________________________________
Welcome back to the channel! In this video, we dive deep into the latest inflation data and its impact on the markets. We'll discuss CPI figures, intermarket assets to watch, and seasonality charts to help you make informed trading decisions.
Discover key support and resistance levels, bullish and bearish scenarios, and potential market-moving catalysts. Plus, we explore the intriguing possibility of a significant market move and hidden levels.
Stay tuned as we analyze market trends without appearing on camera, using stock charts and insightful commentary. Don't forget to like, subscribe, and hit the notification bell for the latest market updates. Let's navigate the world of finance together!
🔔 Subscribe now and never miss an update: https://www.youtube.com/c/figuringoutmoney?sub_confirmation=1
📧 For business inquiries or collaboration opportunities, please contact us at FiguringOutMoney@gmail.com
📈 Follow us on social media for more insights and updates:
🟢 Instagram: https://www.instagram.com/figuringoutmoney
🟢 Twitter: https://twitter.com/mikepsilva
______________________________________________________________________________________________
How To Predict How Far Stocks Can Go (EXPECTED MOVES):
○ https://youtu.be/JT32L89ZpEk
Saylor To Schiff Bitcoin Indicator:
○ https://youtu.be/zuG9Tjnud9k
Show Me The Money Scan:
○ https://youtu.be/dzRjEuUUb5g
Party Starter Scan:
○ https://youtu.be/zzaN91gcJOI
Bouncy Ball Scan:
○ https://youtu.be/7xKOo6vNaq8
Dark Money Scan:
○ https://youtu.be/ZUMuHaSg1ro
Sleepy Monster Scan:
○ https://youtu.be/C9EQkA7uVU8
High Volatility Scan:
○ https://youtu.be/VC327ko8DfE
______________________________________________________________________________________________
DISCLAIMER: I am not a professional investment advisor, nor do I claim to be. All my videos are for entertainment and educational purposes only. This is not trading advice. I am wrong all the time. Everything you watch on my channel is my opinion. Links included in this description might be affiliate links. If you purchase a product or service with the links that I provide I may receive a small commission. There is no additional charge to you! Thank you for supporting my channel :)
#Stockmarket #StockMarketAnalysis #DayTrading
38
views
This Is Not Good For The Stock Market...
🟢 BOOKMAP DISCOUNT (PROMO CODE "BM20" for 20% off the monthly plans): https://bookmap.com/members/aff/go/figuringoutmoney?i=79
🟢 TRADE IDEAS & DISCORD: https://www.patreon.com/figuringoutmoney
🟢 TRADE WITH IBKR: http://bit.ly/3mIUUfC
__________________________________________________________________________________________
Join us for an in-depth analysis of the upcoming inflation report, set to be released one hour before the market opens. We'll break down core inflation, month-over-month rates, and year-over-year numbers, providing insights into what to expect.
As we delve into the data, we'll explore how core inflation has been trending downwards, while overall inflation, including food and energy, is on the rise. Oil prices have been surging, with a strong correlation to energy stocks and bond yields.
Discover the potential consequences for the stock market and understand the intermarket correlations at play. Will rising oil prices lead to a market downturn, or will it propel energy stocks and bond yields even higher?
We'll also examine market risk ahead of the report, offering key levels to watch and technical analysis for both bullish and bearish scenarios.
Don't miss this essential pre-report analysis! Hit that 'Subscribe' button and 'Like' this video to stay updated on the latest financial insights. See you in the markets!
🔔 Subscribe now and never miss an update: https://www.youtube.com/c/figuringoutmoney?sub_confirmation=1
📧 For business inquiries or collaboration opportunities, please contact us at FiguringOutMoney@gmail.com
📈 Follow us on social media for more insights and updates:
🟢 Instagram: https://www.instagram.com/figuringoutmoney
🟢 Twitter: https://twitter.com/mikepsilva
______________________________________________________________________________________________
How To Predict How Far Stocks Can Go (EXPECTED MOVES):
○ https://youtu.be/JT32L89ZpEk
Saylor To Schiff Bitcoin Indicator:
○ https://youtu.be/zuG9Tjnud9k
Show Me The Money Scan:
○ https://youtu.be/dzRjEuUUb5g
Party Starter Scan:
○ https://youtu.be/zzaN91gcJOI
Bouncy Ball Scan:
○ https://youtu.be/7xKOo6vNaq8
Dark Money Scan:
○ https://youtu.be/ZUMuHaSg1ro
Sleepy Monster Scan:
○ https://youtu.be/C9EQkA7uVU8
High Volatility Scan:
○ https://youtu.be/VC327ko8DfE
______________________________________________________________________________________________
DISCLAIMER: I am not a professional investment advisor, nor do I claim to be. All my videos are for entertainment and educational purposes only. This is not trading advice. I am wrong all the time. Everything you watch on my channel is my opinion. Links included in this description might be affiliate links. If you purchase a product or service with the links that I provide I may receive a small commission. There is no additional charge to you! Thank you for supporting my channel :)
#Stockmarket #StockMarketAnalysis #DayTrading
1
view
The Silent Economic Crisis That's Brewing
🟢 BOOKMAP DISCOUNT (PROMO CODE "BM20" for 20% off the monthly plans): https://bookmap.com/members/aff/go/figuringoutmoney?i=79
🟢 TRADE IDEAS & DISCORD: https://www.patreon.com/figuringoutmoney
🟢 TRADE WITH IBKR: http://bit.ly/3mIUUfC
__________________________________________________________________________________________
Dive into an in-depth analysis of the looming economic storm that's hiding in plain sight. In a world dominated by data-driven decisions, what happens when the numbers betray us? Join us in this episode of the Stock Market Brief Show as we:
- Explore the unexpected indicators pointing towards a potential economic crisis.
- Delve into the patterns and historical data from 1985, 2008, and the potential for 2023.
- Discuss the current state of the stock market, including the controversial opinions surrounding its future.
- Shed light on the mounting credit card debt, student loans, and their possible repercussions.
- Highlight key insights from industry stalwarts like Jamie Dimon.
Whether you're a seasoned investor or just curious about the state of our economy, this video will offer valuable perspectives. Remember, it's not about predicting the future, but understanding the present.
🔔 Subscribe now and never miss an update: https://www.youtube.com/c/figuringoutmoney?sub_confirmation=1
📧 For business inquiries or collaboration opportunities, please contact us at FiguringOutMoney@gmail.com
📈 Follow us on social media for more insights and updates:
🟢 Instagram: https://www.instagram.com/figuringoutmoney
🟢 Twitter: https://twitter.com/mikepsilva
______________________________________________________________________________________________
How To Predict How Far Stocks Can Go (EXPECTED MOVES):
○ https://youtu.be/JT32L89ZpEk
Saylor To Schiff Bitcoin Indicator:
○ https://youtu.be/zuG9Tjnud9k
Show Me The Money Scan:
○ https://youtu.be/dzRjEuUUb5g
Party Starter Scan:
○ https://youtu.be/zzaN91gcJOI
Bouncy Ball Scan:
○ https://youtu.be/7xKOo6vNaq8
Dark Money Scan:
○ https://youtu.be/ZUMuHaSg1ro
Sleepy Monster Scan:
○ https://youtu.be/C9EQkA7uVU8
High Volatility Scan:
○ https://youtu.be/VC327ko8DfE
______________________________________________________________________________________________
DISCLAIMER: I am not a professional investment advisor, nor do I claim to be. All my videos are for entertainment and educational purposes only. This is not trading advice. I am wrong all the time. Everything you watch on my channel is my opinion. Links included in this description might be affiliate links. If you purchase a product or service with the links that I provide I may receive a small commission. There is no additional charge to you! Thank you for supporting my channel :)
#Stockmarket #StockMarketAnalysis #DayTrading
6
views
1
comment
Preparing For A Stock Market Bounce!
🟢 BOOKMAP DISCOUNT (PROMO CODE "BM20" for 20% off the monthly plans): https://bookmap.com/members/aff/go/figuringoutmoney?i=79
🟢 TRADE IDEAS & DISCORD: https://www.patreon.com/figuringoutmoney
🟢 TRADE WITH IBKR: http://bit.ly/3mIUUfC
__________________________________________________________________________________________
Join Michael Silva on the Stock Market Brief Show as he discusses the potential for a stock market rebound in the coming week. Analyzing various indicators like the Bullish Percent Index and market seasonality, Michael provides insights into both the bullish and bearish scenarios, highlighting key levels to watch. He also delves into market movers, economic events, and technical analysis, offering valuable information to help you navigate the stock market with caution and confidence. Don't miss out on this in-depth analysis to prepare for what lies ahead in the markets. Subscribe for more insightful content!"
🔔 Subscribe now and never miss an update: https://www.youtube.com/c/figuringoutmoney?sub_confirmation=1
📧 For business inquiries or collaboration opportunities, please contact us at FiguringOutMoney@gmail.com
📈 Follow us on social media for more insights and updates:
🟢 Instagram: https://www.instagram.com/figuringoutmoney
🟢 Twitter: https://twitter.com/mikepsilva
______________________________________________________________________________________________
How To Predict How Far Stocks Can Go (EXPECTED MOVES):
○ https://youtu.be/JT32L89ZpEk
Saylor To Schiff Bitcoin Indicator:
○ https://youtu.be/zuG9Tjnud9k
Show Me The Money Scan:
○ https://youtu.be/dzRjEuUUb5g
Party Starter Scan:
○ https://youtu.be/zzaN91gcJOI
Bouncy Ball Scan:
○ https://youtu.be/7xKOo6vNaq8
Dark Money Scan:
○ https://youtu.be/ZUMuHaSg1ro
Sleepy Monster Scan:
○ https://youtu.be/C9EQkA7uVU8
High Volatility Scan:
○ https://youtu.be/VC327ko8DfE
______________________________________________________________________________________________
DISCLAIMER: I am not a professional investment advisor, nor do I claim to be. All my videos are for entertainment and educational purposes only. This is not trading advice. I am wrong all the time. Everything you watch on my channel is my opinion. Links included in this description might be affiliate links. If you purchase a product or service with the links that I provide I may receive a small commission. There is no additional charge to you! Thank you for supporting my channel :)
#Stockmarket #StockMarketAnalysis #DayTrading
10
views
What Stocks Benefit From A Weakened Dollar?
🟢 BOOKMAP DISCOUNT (PROMO CODE "BM20" for 20% off the monthly plans): https://bookmap.com/members/aff/go/figuringoutmoney?i=79
🟢 TRADE IDEAS & DISCORD: https://www.patreon.com/figuringoutmoney
🟢 TRADE WITH IBKR: http://bit.ly/3mIUUfC
__________________________________________________________________________________________
In today's episode of the Stock Market Brief Show, we dive into the recent surge of the dollar and its implications on the S&P 500. Discover which sectors stood out and how the market reacted to the latest news surrounding big players like Apple and Walmart. We'll also highlight how shifts in the dollar's strength can create opportunities in other assets, with a focus on silver, gold, and their correlated markets. With insights from technical charts, seasonality trends, and in-depth analyses, you'll be equipped to navigate the potential moves of the market. Tune in for key insights and strategy pointers!
🔔 Subscribe now and never miss an update: https://www.youtube.com/c/figuringoutmoney?sub_confirmation=1
📧 For business inquiries or collaboration opportunities, please contact us at FiguringOutMoney@gmail.com
📈 Follow us on social media for more insights and updates:
🟢 Instagram: https://www.instagram.com/figuringoutmoney
🟢 Twitter: https://twitter.com/mikepsilva
______________________________________________________________________________________________
How To Predict How Far Stocks Can Go (EXPECTED MOVES):
○ https://youtu.be/JT32L89ZpEk
Saylor To Schiff Bitcoin Indicator:
○ https://youtu.be/zuG9Tjnud9k
Show Me The Money Scan:
○ https://youtu.be/dzRjEuUUb5g
Party Starter Scan:
○ https://youtu.be/zzaN91gcJOI
Bouncy Ball Scan:
○ https://youtu.be/7xKOo6vNaq8
Dark Money Scan:
○ https://youtu.be/ZUMuHaSg1ro
Sleepy Monster Scan:
○ https://youtu.be/C9EQkA7uVU8
High Volatility Scan:
○ https://youtu.be/VC327ko8DfE
______________________________________________________________________________________________
DISCLAIMER: I am not a professional investment advisor, nor do I claim to be. All my videos are for entertainment and educational purposes only. This is not trading advice. I am wrong all the time. Everything you watch on my channel is my opinion. Links included in this description might be affiliate links. If you purchase a product or service with the links that I provide I may receive a small commission. There is no additional charge to you! Thank you for supporting my channel :)
#Stockmarket #StockMarketAnalysis #DayTrading
20
views
How Seasonal Variations Impact The S&P 500: Exploring Movements And Expectations
🟢 BOOKMAP DISCOUNT (PROMO CODE "BM20" for 20% off the monthly plans): https://bookmap.com/members/aff/go/figuringoutmoney?i=79
🟢 TRADE IDEAS & DISCORD: https://www.patreon.com/figuringoutmoney
🟢 TRADE WITH IBKR: http://bit.ly/3mIUUfC
__________________________________________________________________________________________
In today's stock market briefing show, we delve into Dollar and S&P 500 seasonality. We examine various divergences that are currently emerging, potentially indicating trouble for the stock market. Additionally, we analyze the yield curve inversion to assess the safety of the markets.
🔔 Subscribe now and never miss an update: https://www.youtube.com/c/figuringoutmoney?sub_confirmation=1
📧 For business inquiries or collaboration opportunities, please contact us at FiguringOutMoney@gmail.com
📈 Follow us on social media for more insights and updates:
🟢 Instagram: https://www.instagram.com/figuringoutmoney
🟢 Twitter: https://twitter.com/mikepsilva
______________________________________________________________________________________________
How To Predict How Far Stocks Can Go (EXPECTED MOVES):
○ https://youtu.be/JT32L89ZpEk
Saylor To Schiff Bitcoin Indicator:
○ https://youtu.be/zuG9Tjnud9k
Show Me The Money Scan:
○ https://youtu.be/dzRjEuUUb5g
Party Starter Scan:
○ https://youtu.be/zzaN91gcJOI
Bouncy Ball Scan:
○ https://youtu.be/7xKOo6vNaq8
Dark Money Scan:
○ https://youtu.be/ZUMuHaSg1ro
Sleepy Monster Scan:
○ https://youtu.be/C9EQkA7uVU8
High Volatility Scan:
○ https://youtu.be/VC327ko8DfE
______________________________________________________________________________________________
DISCLAIMER: I am not a professional investment advisor, nor do I claim to be. All my videos are for entertainment and educational purposes only. This is not trading advice. I am wrong all the time. Everything you watch on my channel is my opinion. Links included in this description might be affiliate links. If you purchase a product or service with the links that I provide I may receive a small commission. There is no additional charge to you! Thank you for supporting my channel :)
#Stockmarket #StockMarketAnalysis #DayTrading
10
views
Stock Market Wizard Shares His Complete Contrarian Trading Strategy | Jason Shapiro
🟢 BOOKMAP DISCOUNT (PROMO CODE "BM20" for 20% off the monthly plans): https://bookmap.com/members/aff/go/figuringoutmoney?i=79
🟢 TRADE IDEAS & DISCORD: https://www.patreon.com/figuringoutmoney
🟢 TRADE WITH IBKR: http://bit.ly/3mIUUfC
__________________________________________________________________________________________
In today's interview with Jason Shapiro we dive into his complete process by asking questions around the only 4 things we can control as traders.
Intro: 00:00
1. How he determines what to buy? 01:20
2. When do you execute the trade? 08:15
3. How much to buy? (Position Sizing) 13:38
4. When do you get out of a position? 22:19
5: Final Golden Nugget 33:05
🔔 Subscribe now and never miss an update: https://www.youtube.com/c/figuringoutmoney?sub_confirmation=1
📧 For business inquiries or collaboration opportunities, please contact us at FiguringOutMoney@gmail.com
📈 Follow us on social media for more insights and updates:
🟢 Instagram: https://www.instagram.com/figuringoutmoney
🟢 Twitter: https://twitter.com/mikepsilva
______________________________________________________________________________________________
How To Predict How Far Stocks Can Go (EXPECTED MOVES):
○ https://youtu.be/JT32L89ZpEk
Saylor To Schiff Bitcoin Indicator:
○ https://youtu.be/zuG9Tjnud9k
Show Me The Money Scan:
○ https://youtu.be/dzRjEuUUb5g
Party Starter Scan:
○ https://youtu.be/zzaN91gcJOI
Bouncy Ball Scan:
○ https://youtu.be/7xKOo6vNaq8
Dark Money Scan:
○ https://youtu.be/ZUMuHaSg1ro
Sleepy Monster Scan:
○ https://youtu.be/C9EQkA7uVU8
High Volatility Scan:
○ https://youtu.be/VC327ko8DfE
______________________________________________________________________________________________
DISCLAIMER: I am not a professional investment advisor, nor do I claim to be. All my videos are for entertainment and educational purposes only. This is not trading advice. I am wrong all the time. Everything you watch on my channel is my opinion. Links included in this description might be affiliate links. If you purchase a product or service with the links that I provide I may receive a small commission. There is no additional charge to you! Thank you for supporting my channel :)
#Stockmarket #StockMarketAnalysis #DayTrading
14
views