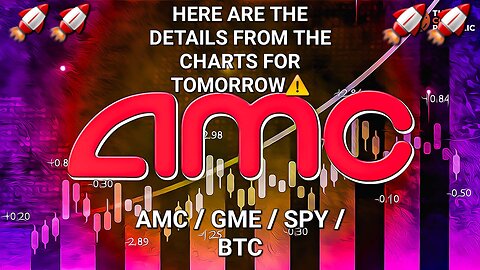
11 months agoHere Are The Details From The Charts For Tomorrow "AMC, GME , SPY & BTC "Update & Prediction"DataZero
29 days agoU.S. GDP Growth Sparks Debt Concerns as NVIDIA Stock Slides - Kitco NewsKitco NEWSVerified
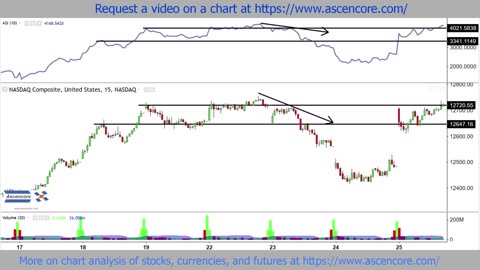
10 months agoNASDAQ Composite Stock Chart Accumulation Swing Index (ASI) Indicator Analysis ExampleAscencore
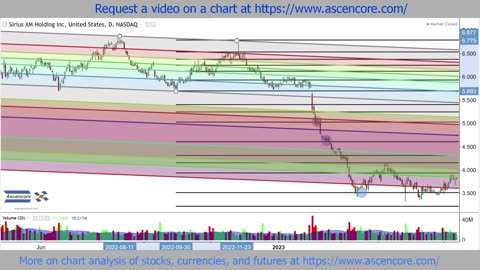
9 months agoFibonacci Channels Combined With Retracements For Time Analysis SIRI Stock Chart ExampleAscencore
9 months agoStock Chart Technical Analysis (Gravestone Doji) Candlestick Chart Pattern AnalysisAscencore
24 days agoICP and Hedera CHARTS $100, $200 ? || HBAR & ICP News Latest News & Analysis - 9/24/24Crypto for the Rest of Us
10 months agoStock Market Analysis with Phil Grande of Phil's Gang Radio Show 11/28/2023The Phil's Gang Radio Show ChannelVerified
1 year ago#BIOR 🔥 #AMV 🔥 two crazy stocks! moved crazy and can move even crazier! see the charts $amv $biorda_stock_analyst
3 years agoWorkHorse Stock News SPAC Market Charts PSTH Hyliion TTCF SPY UVXY JWS GSAH FST SBE USPSOctopusMoneyMultipliers
1 year agoGold's Spectacular Breakout: Charts Point to Phenomenal Move After 12-Year WaitKitco NEWSVerified