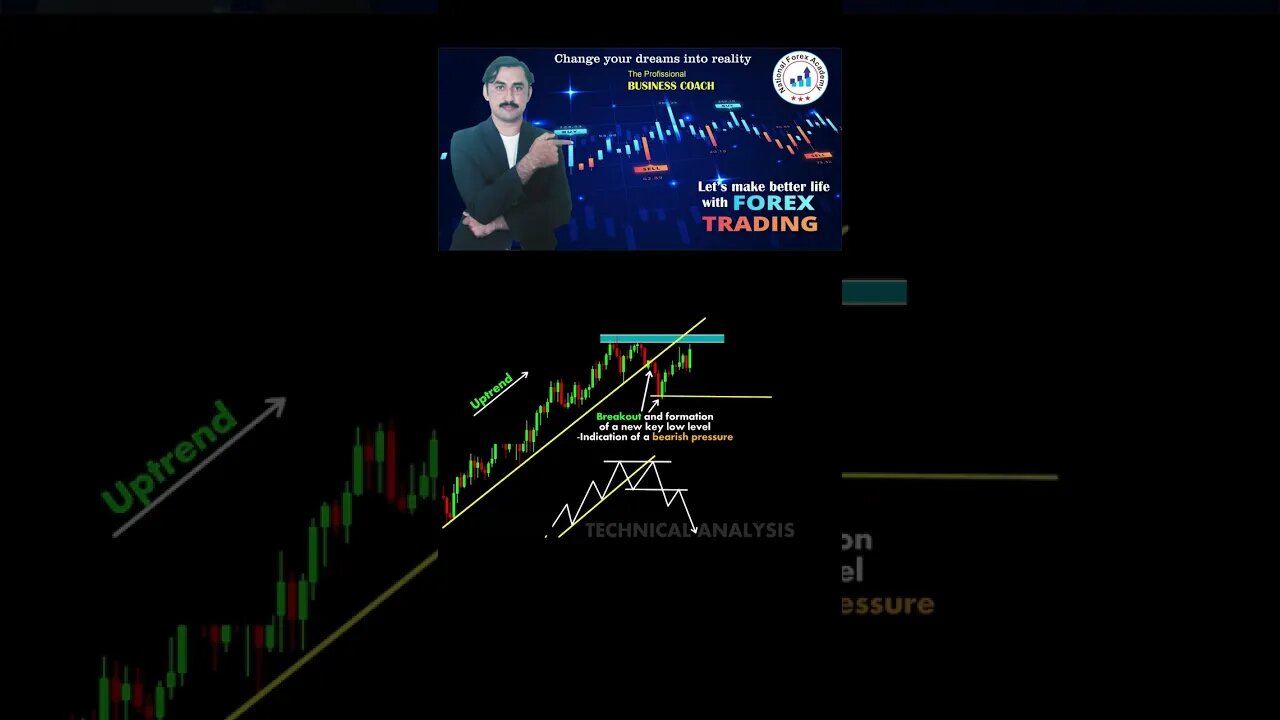
Technical Analysis Charts for Beginners in Stock Market | National Forex Academy
#Technical Analysis
#Charts for Beginners
#Stock Market
#National Forex Academy
#deriv
#Technical analysis chart patterns candlestick stock
#price action
#technical analysis
#trendline
#national forex academy
#mohammad sadar khan
#trading
#deriv trading
#octa trading
#octafx
#octafxtrading
#online earning
#deriv basic setting with a profitable trade
# how to draw a trendline
#How to use support and resistance
#risk management
# how to save your account from big losses
A.A! Here's Mohammad Sadar Khan. In this video, I will tell you about the deriv best settings as like changing the color of the candlestick, object sets, timeframes, standards, line studies, market watching, toolbox, how to draw a perfect trendline, how to draw support resistance, how to take profitable trade etc.
I hope this video will be helpful for you.
Please subscribe to this channel for the best community.
How we can make an account on deriv:https://youtu.be/Mbtk5M2cIc4
# Mohammad Sadar Kha'n
#SadarKhan_TV
My Other Channels:
1.Sadar Khan.Com : https://youtu.be/gK-935VtHOA
2.Css Self Creator: https://www.youtube.com/channel/UCze0PWCrmCG7sXOn5EArJ6Q
3. English Technical Raftaar: https://youtu.be/PfQK8M3PurA
4. Shorthand With Sadar Khan:
-
 LIVE
LIVE
SpartakusLIVE
3 hours ago#1 Saturday Spartoons on RUMBLE PREMIUM
6,102 watching -
 LIVE
LIVE
Mally_Mouse
21 hours ago🌶️ 🥵Spicy BITE Saturday!! 🥵🌶️- Let's Play: Tower Unite!
1,034 watching -
 58:59
58:59
MattMorseTV
2 hours ago $0.24 earned🔴Trump just BROKE Newsom.🔴
22.7K8 -
 18:14
18:14
Her Patriot Voice
2 hours agoWho Is WORSE for NYC: Trump Girl or Socialist?
3.91K15 -
 LIVE
LIVE
SavageJayGatsby
1 hour agoSpicy Saturday with Mally! | Road to 100 | $300 Weekly Goal for Spicy Bites!
3,651 watching -
 6:04:40
Akademiks
6 hours agoRoc Nation & Meg Thee Stallion did a 7 HOUR Deposition with me. Drake Secret Kid Finally Revealed.
27.7K1 -
 24:19
24:19
Stephen Gardner
2 hours ago🚨BREAKING: FBI Raid of John Bolton’s House Reveals THIS!
29.7K66 -
 8:31
8:31
MattMorseTV
5 hours ago $0.82 earnedTexas just did the IMPOSSIBLE.
27.6K56 -
 24:39
24:39
MYLUNCHBREAK CHANNEL PAGE
1 day agoInterdimensional Beings at Borobudur
38K19 -
 12:42
12:42
Scammer Payback
23 hours agoCalling Scammers who were Raided
15.1K10