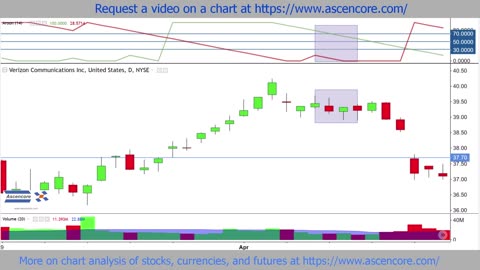
11 months agoVerizon Stock Chart Bullish Reversal Potential Analysis With The Aroon IndicatorAscencore
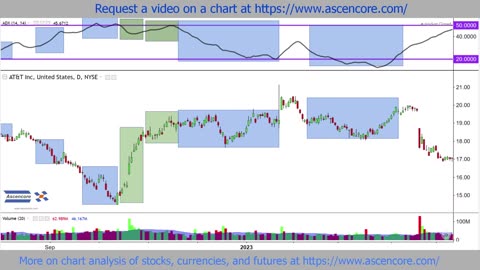
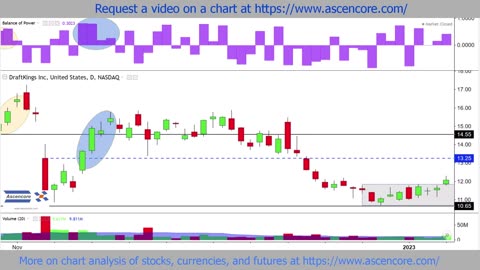
11 months agoBullish Stock Chart Analysis With The Balance Of Power Indicator (DKNG) ExampleAscencore
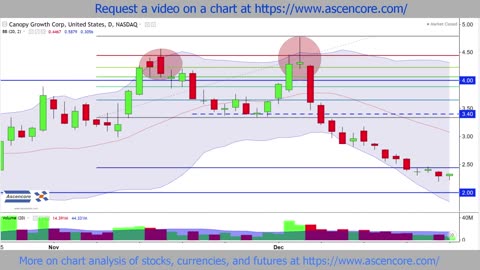
11 months agoNetflix (NFLX) Stock Chart Analysis With The Awesome Oscillator Twin Peaks SetupAscencore
11 months agoStock Chart Technical Analysis (Bearish Engulfing) Candlestick Chart Pattern AnalysisAscencore
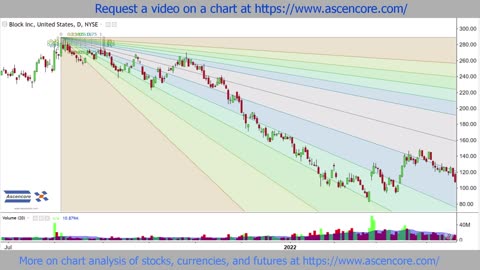
10 months agoFibonacci Speed Resistance Fan Analysis Example With Block Inc, (SQ) Stock ChartAscencore
11 months ago(HPE) Hewlett Packard Stock Chart Analysis Using The Chande Momentum OscillatorAscencore
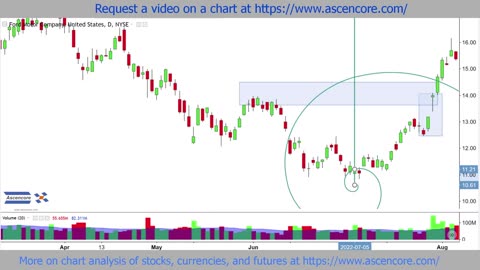
11 months agoSimple Ways To Use Fibonacci Arcs (General Electric (GE) Stock Chart Analysis Example)Ascencore
10 months agoLuckin Coffee (LKNCY) Stock Chart Analysis Fibonacci Channel Time Analysis ExampleAscencore