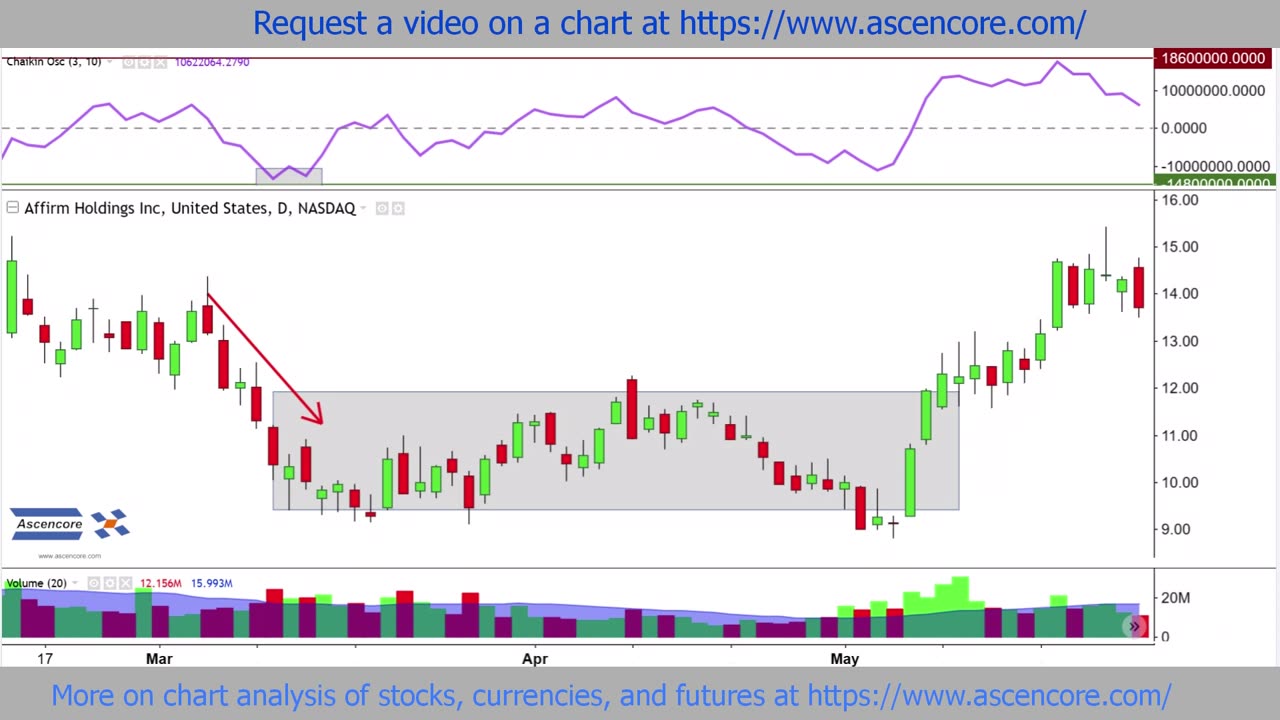
Affirm Holdings Inc (AFRM) Stock Chart Analysis With The Chaikin Oscillator
1 year ago
24
Visit https://www.ascencore.com/ for more helpful resources and chart analysis examples.
Copyright © 2023
Produced by Ascencore
Loading comments...
-
 19:49
19:49
Ascencore
8 days agoWhy The Stock Market Went Crazy Over Figma - FIG Stock
492 -
 LIVE
LIVE
Redacted News
1 hour ago"There will be consequences!!!" Trump issues big threat to Putin ahead of peace summit | Redacted
15,097 watching -
 1:11:53
vivafrei
7 hours agoThe Great Replacement of American Truckers With Unskilled Foreign Labor - Live with Gord Magill
67.4K33 -
 2:11:18
The Quartering
3 hours agoToday's Breaking News! Disgusting Grocery Shopping "Haul" Goes Viral, Las Vegas Collapse & More
68.8K11 -
 LIVE
LIVE
StoneMountain64
3 hours agoBest Extraction shooter is FINALLY on Console (+CoD Reveal Today)
405 watching -
 LIVE
LIVE
Due Dissidence
5 hours agoZelensky RETURNS To DC, HUGE Protests In Israel, Gal Gadot Blames Palestine For Flop, MSNBC Rebrands
1,008 watching -
 LIVE
LIVE
The HotSeat
1 hour ago🚨 Dems Swear Mail-In Voting Is “Secure”… Trump Says HELL NO 🚨
565 watching -
 LIVE
LIVE
Reidboyy
7 hours ago $0.55 earnedNEW FREE FPS OUT ON CONSOLE TODAY! (Delta Force = BF6 Jr.)
73 watching -
 29:20
29:20
Stephen Gardner
1 hour ago🔥YES! Trump unleashes Democrats’ worst nightmare!
6.42K4 -
![[Ep 731] Trump Leading the World | Islam NOT Compatible with West | Guest Sam Anthony [your[NEWS](https://1a-1791.com/video/fww1/93/s8/1/c/n/K/a/cnKaz.0kob-small-Ep-731-Trump-Leading-the-Wo.jpg) LIVE
LIVE
The Nunn Report - w/ Dan Nunn
1 hour ago[Ep 731] Trump Leading the World | Islam NOT Compatible with West | Guest Sam Anthony [your[NEWS
173 watching