6 months agoUNG (United States Natural Gas Fund ETF) Chart Analysis ATR Example Case Study 1Ascencore
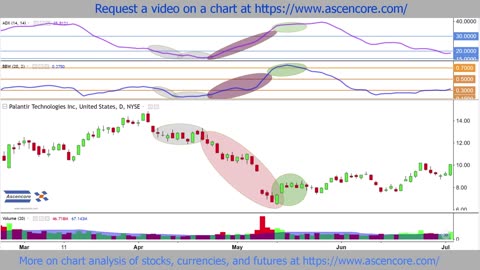
6 months agoPalantir Technologies (PLTR) Chart Analysis With The (ADX) Average Directional Index IndicatorAscencore
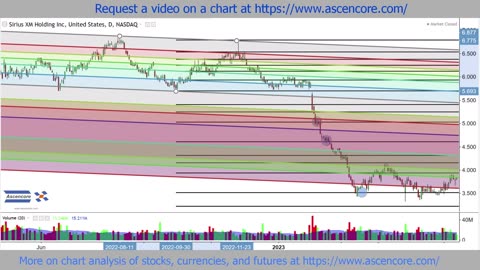
5 months agoFibonacci Channels Combined With Retracements For Time Analysis SIRI Stock Chart ExampleAscencore
6 months agoNASDAQ Composite Stock Chart Accumulation Swing Index (ASI) Indicator Analysis ExampleAscencore
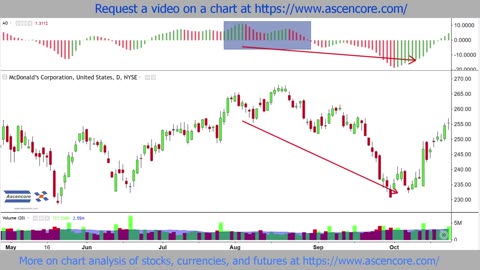
6 months agoMcDonald’s (MCD) Stock Chart Analysis With The Awesome Oscillator Twin Peaks SetupAscencore
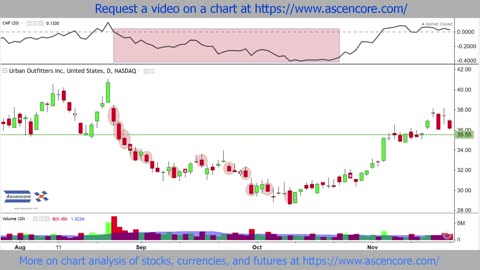
6 months agoUrban Outfitters (URBN) Stock Chart Analysis With The Chaikin Money Flow IndicatorAscencore
6 months agoIntel (INTC) Stock Chart Analysis Using The Arnaud Legoux Moving Average (ALMA) IndicatorAscencore
5 months agoFibonacci Speed Resistance Fan Analysis Example With Block Inc, (SQ) Stock ChartAscencore
5 months agoLuckin Coffee (LKNCY) Stock Chart Analysis Fibonacci Channel Time Analysis ExampleAscencore
6 months ago(USO) United States Oil Fund ETF Chart Analysis With The Chande Kroll Stop indicatorAscencore