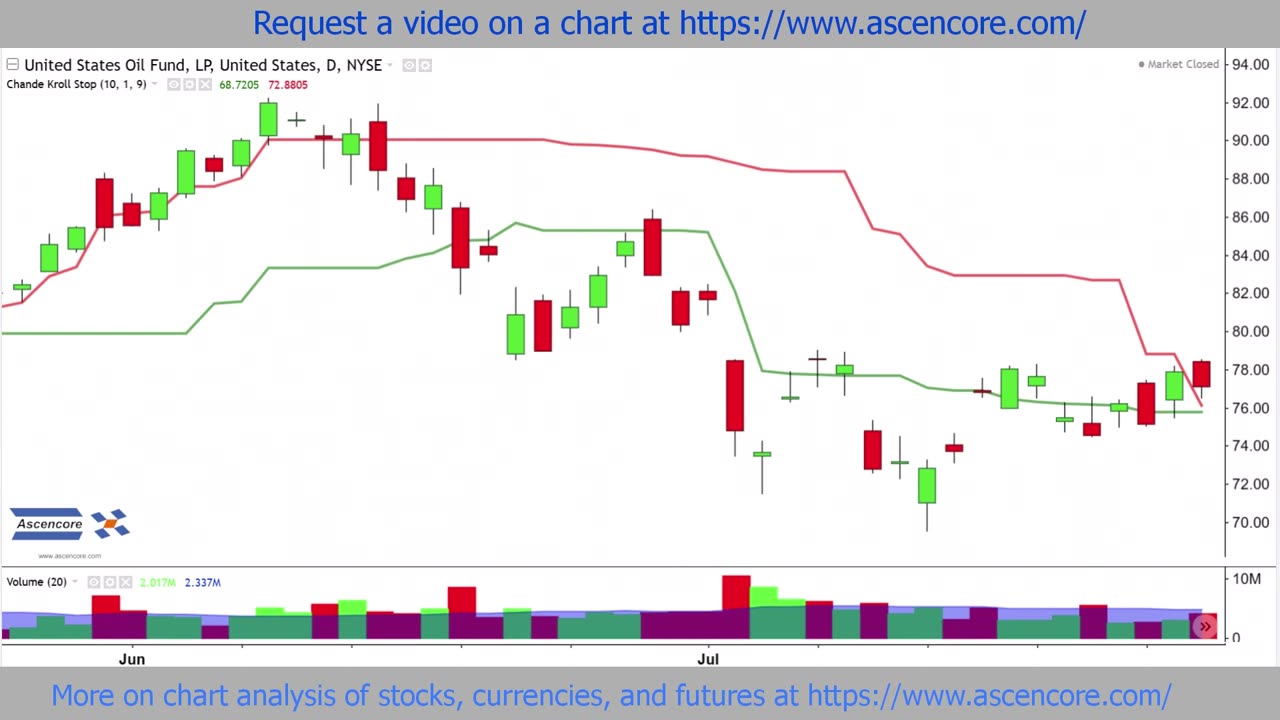
(USO) United States Oil Fund ETF Chart Analysis With The Chande Kroll Stop indicator
1 year ago
9
Visit https://www.ascencore.com/ for more helpful resources and chart analysis examples.
Copyright © 2024
Produced by Ascencore
Loading comments...
-
 13:45
13:45
Ascencore
3 months agoHow To Use The Trend Based Time Zone
292 -
 1:54:08
The Michelle Moore Show
17 hours ago'Medical Preparedness...Your Gateway to Freedom, Foods Parasites Hate, and more' Guest, Dr. Shawn Rowland, Founder of Jase Medical: The Michelle Moore Show (July 29, 2025)
9.03K8 -
 15:05
15:05
The Pascal Show
10 hours ago $0.01 earnedHOLY SH*T! The Missing Minute From Epstein’s Jail Video Has Been FOUND
1.93K2 -
 LIVE
LIVE
Lofi Girl
2 years agoSynthwave Radio 🌌 - beats to chill/game to
167 watching -
 2:14:32
Inverted World Live
7 hours agoHarvard Astronomer Says Hostile Alien Spaceship Heading Toward Earth | Ep. 82
215K47 -
 2:29:34
Brandon Gentile
4 days agoHow To Retire 10 Years Early with Just 0.1 Bitcoin
6.51K2 -
 3:19:34
Laura Loomer
7 hours agoEP135: Champagne Communism: Zohran Mamdani's Ugandan Compound EXPOSED
42.8K8 -
 28:39
28:39
The Why Files
3 days agoCryptids Vol. 4 | Bunyips, Yowie and Australian Nightmare Fuel
54.4K38 -
 1:07:06
Mike Rowe
18 days agoThe Fight For America's Heartland | Salena Zito #442 | The Way I Heard It
39.9K48 -
 2:43:30
TimcastIRL
7 hours agoSouth Park Goes FULL CHARLIE KIRK, Latest Episode ROASTS Trump Again | Timcast IRL
223K113