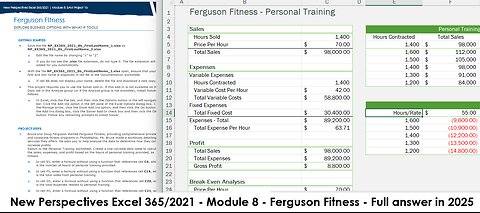
1 month agoNew Perspectives Excel 365/2021 | Module 8: SAM Project 1b | Ferguson Fitness (Update 2025)saxi753
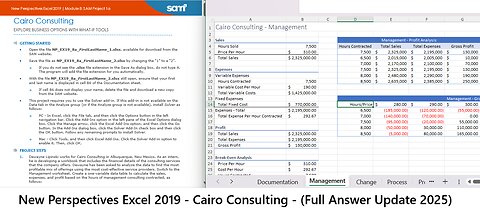
1 month agoNew Perspectives Excel 2019 | Module 8: SAM Project 1a | Cairo Consulting (Update 2025)saxi753
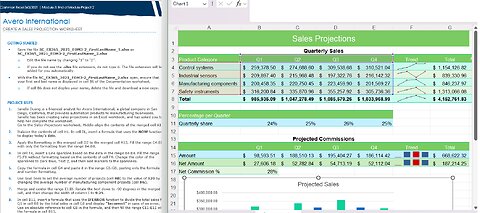
4 months agoShelly Cashman Excel 365/2021 | Module 3: End of Module Project 2 | Avero International Update:2025saxi753
30 days agoShelly Cashman PowerPoint 2019 | Module 6: SAM Project 1a | Oakland College - Full answer 2025saxi753
2 years agoExcel 2016 Waterfall Chart - Advantages and Limitations - Ultimate guide to Excel's Bridge GraphLeila Gharani
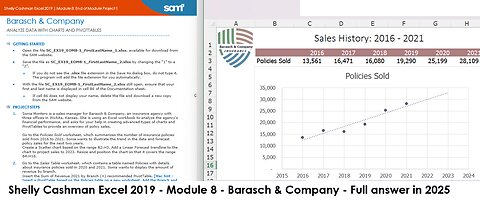
27 days agoShelly Cashman Excel 2019 | Module 8: End of Module Project 1 | Barasch & Company Full answer 2025saxi753
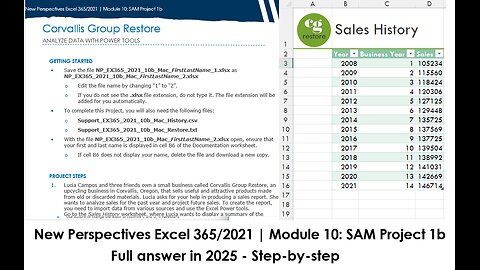
1 month agoNew Perspectives Excel 365/2021 | Module 10: SAM Project 1b | Corvallis Group Restore (Update 2025)saxi753
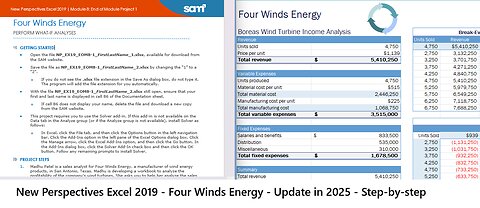
1 month agoNew Perspectives Excel 2019 | Module 8: End of Module Project 1 | Four Winds Energysaxi753
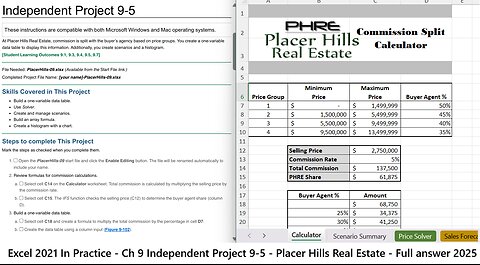
1 month agoExcel 2021 In Practice - Ch 9 Independent Project 9-5 - Placer Hills Real Estate (Full answer 2025)saxi753
22 days agoNew Perspectives PowerPoint 2019 | Module 5: End of Module Project 1| North Bend Municipal Firesaxi753
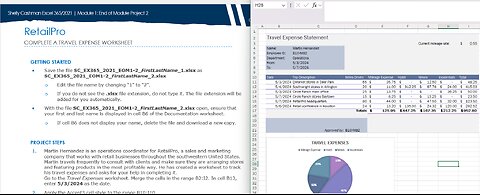
4 months agoShelly Cashman Excel 365/2021 (Update:2025) | Module 1: End of Module Project 2 | RetailProsaxi753
3 years agoGareth Soloway: Sky-High Unemployment Could Cause the Fed to PivotPalisades Gold RadioVerified
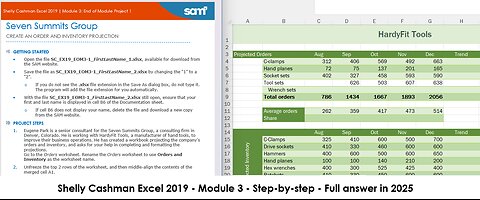
1 month agoShelly Cashman Excel 2019 | Module 3: End of Module Project 1 | Seven Summits Group (Update 2025)saxi753